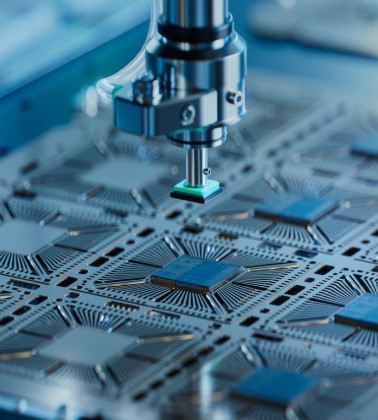
Your Basket
Your Basket
There are no funds in your basket. To add funds to your basket use the Green Plus Icon wherever you see it next to a fund.
Fund name
Aberdeen American Growth  
Fidelity American  
Schroder UK Mid 250  
M&G Recovery  
Jupiter Merlin UK Growth  
Close Basket Open basket

Login

Login

Register

It's look like you're leaving us

What would you like us to do with the funds you've selected

Show me all my options Forget them Save them
Customise this table
 
 
Poll

Do you think UK inflation will increase in the next 12 months?

Yes, it will increase significantly
Yes, it will increase slightly
It will stay at around the same level
No, I think inflation will fall

Vote

 
You are here: A-Z sectors
 

Pension Funds / Sector Performance

 
33 sectors
RankChartSector name 1m 3m 6m 1y 2y 3y 5y 
1chartAsia Pacific Excluding Japan5.32.216.930.013.037.050.5
2chartAsia Pacific Including Japan6.67.624.133.819.631.942.3
3chartCommodity & Energy2.4-15.1-17.9-11.2-33.9-20.1-18.4
4chartDeposit & Treasury-0.1-0.1-0.1-0.10.0-0.13.1
5chartEurope Excluding UK8.05.724.441.312.639.216.7
6chartEurope Including UK8.05.422.737.49.338.314.6
7chartFlexible Investment5.66.517.726.615.833.725.6
8chartGlobal Emerging Markets5.91.214.324.73.817.419.2
9chartGlobal Equities7.98.123.433.620.839.334.2
10chartGlobal Fixed Interest-0.50.42.95.712.212.140.7
11chartGlobal High Yield0.92.09.217.018.027.856.2
12chartGlobal Property3.06.916.325.421.439.616.2
13chartJapan9.822.342.445.236.427.537.4
14chartMixed Investment 0%-35% Shares2.04.28.213.016.625.633.5
15chartMixed Investment 20%-60% Shares3.14.711.317.916.828.831.4
16chartMixed Investment 40%-85% Shares5.26.015.723.817.033.329.7
17chartMoney Market0.10.20.40.50.71.04.1
18chartNorth America8.99.725.532.628.642.854.6
19chartProtected/Guaranteed2.02.75.57.86.411.111.0
20chartSpecialist4.24.812.818.413.223.127.3
21chartSterling Corporate Bond0.24.34.513.119.827.645.6
22chartSterling Fixed Interest-1.03.83.37.219.025.645.0
23chartSterling High Yield1.33.47.116.216.432.457.0
24chartSterling Long Bonds-2.15.31.76.025.431.852.2
25chartSterling Strategic Bond1.13.46.715.316.427.941.2
26chartUK All Companies8.28.021.434.522.951.733.8
27chartUK Direct Property0.60.81.11.53.99.6-2.7
28chartUK Equity Income7.09.120.932.625.853.037.4
29chartUK Gilts-1.92.70.31.517.121.139.7
30chartUK Index - Linked Gilts-2.23.58.35.626.835.147.6
31chartUK Property Securities6.48.215.624.418.636.214.2
32chartUK Smaller Companies5.86.420.935.427.771.852.1
33chartWith Profits0.30.81.63.26.09.114.9
 
  • Stay connected with FE trustnet
  • Authorised and Regulated by the
    Financial Conduct Authority
  • © Trustnet Limited 2013. All Rights Reserved.
  • Please read our Terms of Use / Disclaimer
    and Privacy and Cookie Policy.
  • Data supplied in conjunction with Thomson Financial Limited,
    London Stock Exchange Plc, StructuredRetailProducts.com
    and ManorPark.com