


Almost every fund that specialises in UK bonds has lost money over the past three years, Trustnet research has found, as the era of ultra-loose monetary policy came to a close.
Recent years have been especially challenging for investors, thanks to the tail end of the Covid-19 pandemic, surging inflation, the war in Ukraine and interest rate hikes from the world’s major central banks.
The outcomes for stocks and bonds have been very different, as shown in the chart below. While global equities were up more than 30% over the three years to the end of August 2023 (admittedly, this is roughly where they were at 2021’s close), government and corporate bonds have posted heavy losses.
Performance of stocks and bonds over 3yrs
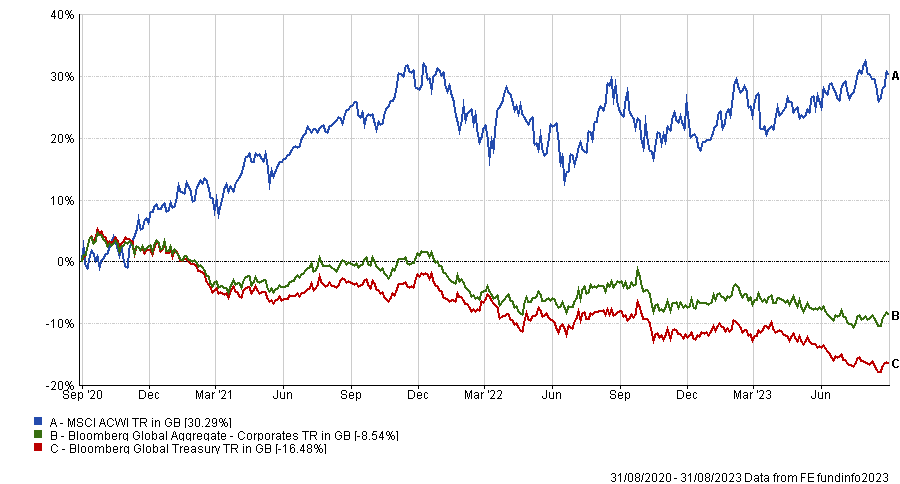
Source: FE Analytics
In this research, Trustnet looks at the proportion of funds in each Investment Association sector that have made a positive and negative return over the past three years.
In four sectors – IA UK Gilts, IA EUR Government Bond, IA EUR Mixed Bond, and IA UK Index Linked Gilts – we found that 100% of the funds have made a loss over the considered period.
The two UK sectors fare especially poorly. The heaviest individual loss came from the Janus Henderson Inst Long Dated Gilt fund, which has fallen 47.9% over the past three years. The best IA UK Gilts fund, on the other hand, was Royal London Short Duration Gilts with its 4.5% drop.
In the IA UK Index Linked Gilts, the average loss among the 17 portfolios we looked at was 34.5%, with the worst fund (Fidelity Index Linked Bond) falling 38.6% and the best one (Scottish Widows UK Index Linked Tracker) losing 29%.
The following chart shows all the sectors where more than half of the funds have made a loss during the three years to the end of August. The grey line indicates the percentage of funds losing money and the teal line shows the positive percentage.
% of funds making positive and negative returns over 3yrs
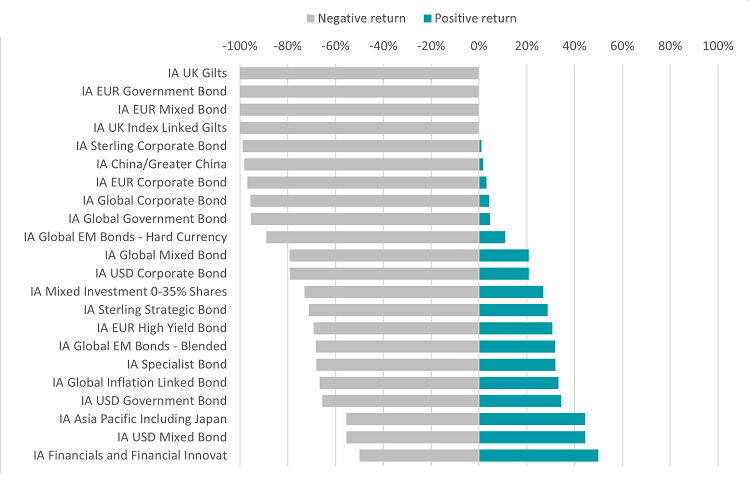
Source: FE Analytics
The IA Sterling Corporate Bond sector finds itself among the sectors where almost every fund lost money. Just one of the 96 funds with a three-year record posted a positive return: M&G Short Dated Corporate Bond, which was up 3.2%.
IA Sterling High Yield has done much better, with only 34% of its members down over three years.
BNY Mellon Global High Yield Bond has fared the worst but its loss of 6.7% is far better than the average IA UK Gilts, IA UK Index Linked Gilts or IA Sterling Corporate Bond fund. Meanwhile, the likes of M&G Global Floating Rate High Yield, Man GLG High Yield Opportunities and NB Short Duration High Yield SDG Engagement have made double-digit gains.
But there are several other bond sectors where the majority of constituents have been down over the past three years. This is due to rising interest rates, which tend to push investors towards higher-yielding assets. However, bonds would be expected to become more attractive once interest rates peak or if central banks decide to cut them again.
The IA China/Greater China sector stands out as the only equity peer group with the vast majority of its members sitting on three-year losses – 98% of its 56 funds have lost money. (In the IA Financials and Financial Innovation sector, at the bottom of the chart, half of the funds are up and half are down)
China has been beset by numerous problems in recent years, such as an extended Covid lockdown, a weakening economy, fallout from regulatory crackdowns on tech companies and weakness among some of its major property developers.
GAM Star China Equity has the worst three-year return, dropping 44.8%, but Templeton China and Invesco PRC Equity have also lost more than 40%. Fidelity China Focus is the only fund in the sector with a positive return as it has made 4.4% over the period examined in this research.