


Investing in emerging markets give exposure to rapidly growing economies, although those markets are considered riskier than their developed peers.
A common index that passive funds track to capture the performance of those economies is the MSCI Emerging Markets and in this article we’re looking for the trackers that have done the best job of matching the index’s returns.
The largest constituents of this index are China, Taiwan, India, South Korea and Brazil while financials, information technology and consumer discretionary are the three largest sectors.
Over the past five years, £1,000 invested directly into the MSCI Emerging Markets index would have returned £1,038.36.
Fidelity Index Emerging Markets is the passive fund that was the closest to match this return, turning £1,000 into £1,033.67 in the same period.
Returns of funds over five years
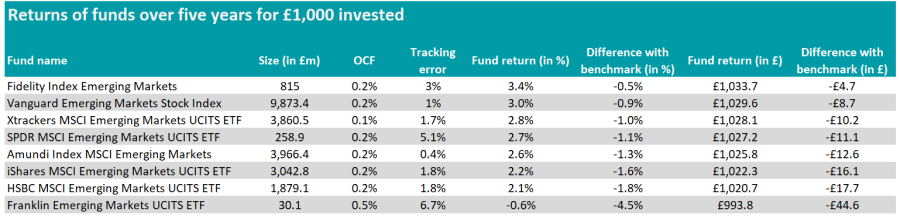
Source: FE Analytics
It is worth noting that no passive funds have outperformed the MSCI Emerging Markets benchmark over the past five years. This is also the case for trackers attempting to replicate the performance of the FTSE 100.
However, it can happen that trackers do better than their benchmark, as it is the case for the S&P 500 for instance.
With a tracking error of 0.37%, Amundi Index MSCI Emerging Markets is the fund that has deviated the least from the benchmark. The other way around, Franklin Emerging Markets UCITS ETF is the tracker that has deviated the most from the MSCI Emerging Markets index, with a tracking error of 6.72%.
Top five sectors and countries by weight
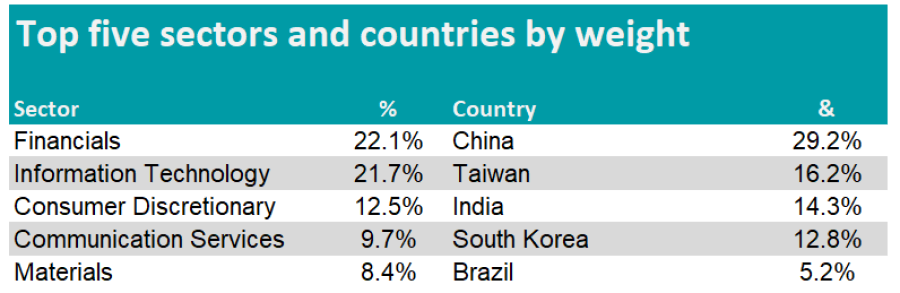
Source: MSCI
Franklin Emerging Markets UCITS ETF is also the most expensive trackers in the list with an ongoing charge figure (OCF) of 0.45%, while Xtrackers MSCI Emerging Markets UCITS ETF is the cheapest with an OCF of 0.08%.
While China remains an emerging market, it is effectively the second largest economy in the world after the US. As a result, some investors might be interested in specifically capturing the performance of Chinese indices, although they would not have been well rewarded, if not punished, for the risks taken.
There are two indices that investors can track: the MSCI China, which encompasses all categories of Chinese stocks, and MSCI China A Share, which only includes the onshore market.
If an investor had invested £1,000 directly in to the MSCI China A Share index, they would have got £1,128.99 after five years.
Lyxor MSCI China A (DR) UCITS ETF, which replicates the performance of the onshore index, would have returned £1,104.29, which is 2.5% less than the MSCI China A index. The fund has a tracking error of 2.99% and an OCF of 0.35%.
While it would have only returned £1,066.27, L&G ETFS-E Fund MSCI China A UCITS ETF has a lower tracking error (2.32%) but a higher OCF (0.88%).
Top five sectors of MSCI China and MSCI China A by weight
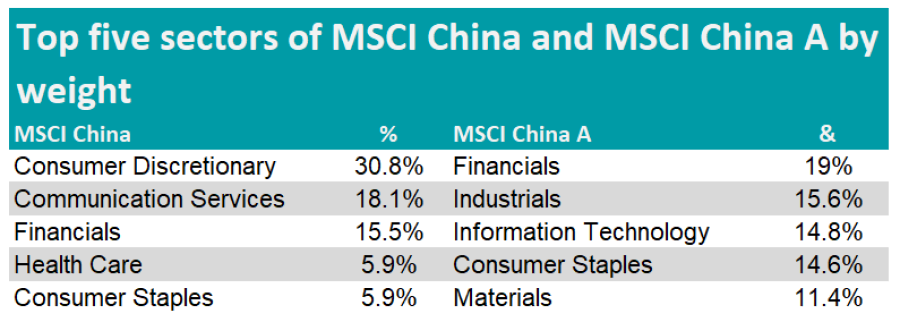
Source: MSCI
Investing in the broader MSCI China index would have resulted in a loss for investors, turning £1,000 into £746.46.