


Funds run by Slater Investments and Royal London Asset Management are among those that have sat at the top of the IA UK All Companies sector for returns, volatility, maximum drawdown and several other performance metrics in recent years, Trustnet research shows. 
This ongoing series looks for funds that have beaten their peers on all fronts over the past three years, ranking sectors on a blend of 10 different risk and return metrics.
Using the most common benchmark for the sector (the FTSE All Share, in the case of IA UK All Companies funds), Trustnet works out an average percentile score for each fund’s cumulative three-year total returns, volatility, alpha, Sharpe ratio, maximum drawdown, upside capture and downside capture over the past three years, as well as returns in each of 2022, 2021 and 2020.
The lower the average percentile, the better the fund has performed overall as it will have been in the upper echelons of its peer group for multiple risk and return metrics over the past three years.
Total return of Slater Recovery vs sector and index over 3yrs to end of 2022
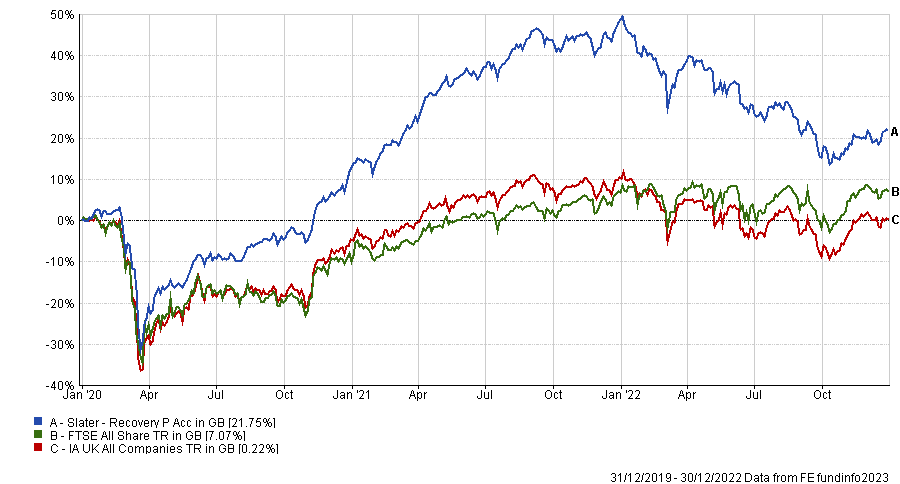
Source: FE Analytics
Coming in first place with an average percentile score of 16.9 is the £443m Slater Recovery fund, run by FE Alpha Manager Mark Slater. Its 21.8% total return over the three years to the end of 2022 is among the highest in the peer group, despite its 17.7% loss last year being in the 77th percentile.
Like the other funds run by Slater Investments, Slater Recovery focuses on companies with strong balance sheets, powerful competitive positions and high returns on capital and this strategy narrows it down to those with low price-to-earnings ratios in relation to their earnings growth.
The fund has been a consistently strong performer in the IA UK All Companies sector, although it should be noted that it is essentially a small-cap portfolio and the bulk of its returns (and 2022’s losses) can be attributed to this.
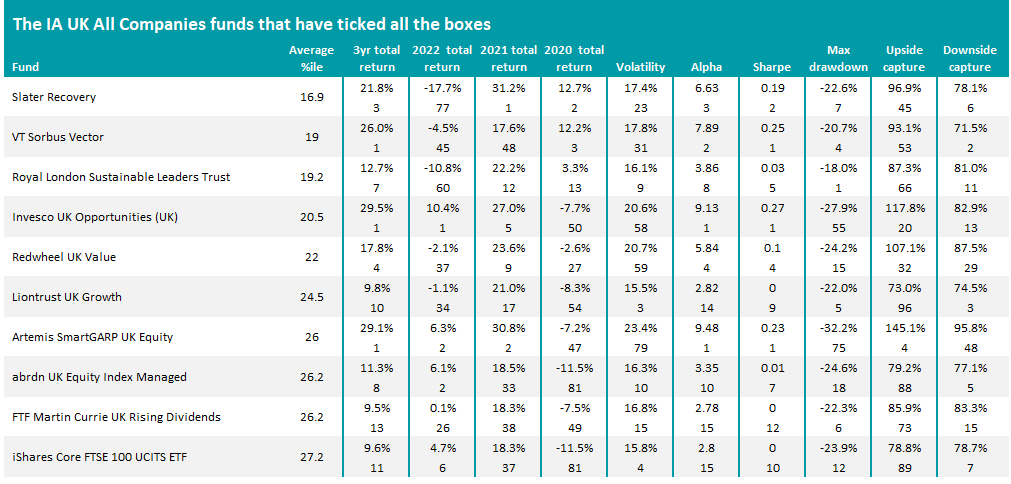
Source: FE Analytics. Top rows show actual returns/risk metrics; bottom rows show percentile rankings
In second place is the VT Sorbus Vector fund, which has an average percentile score of 19. With assets of £48m, it might not be on the radar of many investors but the fund, which is managed by boutique Sorbus Partners, looks for companies it thinks can grow profits across the business cycle – in both good times and bad times.
A recent note from the managers highlighted its strong returns in recent years: “One of the reasons for this outperformance is that generally our fund captures most of the upside of the UK equity markets, but tends to lose much less when markets fall. This is due to our focus on superior business models with strong balance sheets and buying such businesses with a margin of safety in terms of the price we are prepared to pay.”
Royal London Sustainable Leaders Trust, headed by FE fundinfo Alpha Manager Mike Fox, George Crowdy and Sebastien Beguelin, comes in third place with an average percentile score of 19.2. It looks for companies with strong environmental, social and governance (ESG) characteristics, the potential for growth and an attractive valuation.
A preference for technology and industrial companies has helped the fund outperform its peers over the long run, although it did struggle in 2022 when rising interest rates hit growth stocks (which tend to include tech and sustainable names) hard.
The FE Investments team said: “[Royal London Sustainable Leaders] is a very good candidate for investors who specifically want exposure to companies that are making a positive impact for society or operating in a sustainable manner. Mike Fox is a very experienced manager and his track record highlights the benefits of his style – despite several periods of outperformance of cyclical sectors, the fund continues to beat its peers and the wider market over the long term.”
While most of the IA UK All Companies funds in the table above are active strategies, it’s worth pointing out that a number of trackers only just fell short of making it into the top 10.
Indeed, 10 of the funds ranked between 11th and 25th places in this research are passives, especially those that track the FTSE 100. Just below 10th-placed iShares Core FTSE 100 UCITS ETF are Vanguard FTSE 100 Index Unit Trust, HSBC FTSE 100 UCITS ETF and L&G UK 100 Index Trust, among others.
Some of the bigger active names are a bit further down the rankings, reflecting how strategies with a bias to growth stocks have struggled in recent years following an extended run of outperformance and popularity with investors.
Liontrust Special Situations, for example, is ranked 38th out of 242 funds in this study after generating an average percentile score of 33.5 while TB Evenlode Income is 41st after scoring 34. LF Lindsell Train UK Equity is further down, with its average percentile of 40.2 putting it in 79th place and Fidelity Special Situations came 86th with a score of 41.3.
The funds at the very bottom of the table, however, can be seen in the following table.
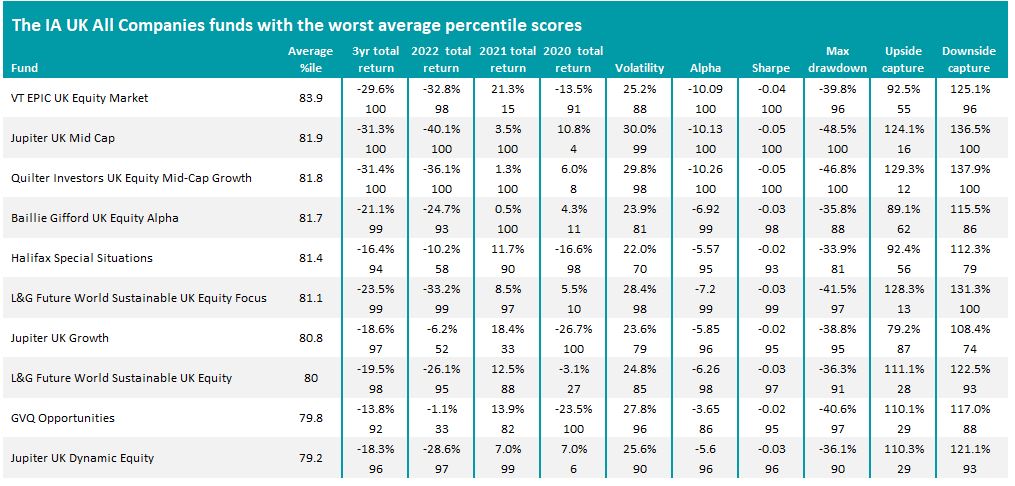
Source: FE Analytics. Top rows show actual returns/risk metrics; bottom rows show percentile rankings
The worst average percentile score came from VT EPIC UK Equity Market: 83.9. The fund is down close to 30% over the three years to the end of 2022; around 45% of the portfolio is in UK small- and mid-caps, which sold off more heavily than large companies last year.
Jupiter has three funds – Jupiter UK Mid Cap, Jupiter UK Growth and Jupiter UK Dynamic Equity – in the bottom 10. All three of these follow the growth style of investing, which as noted above was hit by a major sell-off last year as interest rates rose.