


The easing in the war between the US and Iran has sparked a rally in risk assets, with investments that sold off the most during the conflict – such as momentum stocks, gold and European equities – making the best returns, Trustnet analysis shows.
The US and Israel launched Operation Epic Fury on 28 February 2026, striking nearly 900 targets across Iran in 12 hours, killing supreme leader Ali Khamenei and triggering a wave of retaliatory missile and drone attacks. Iran’s closure of the Strait of Hormuz on 2 March caused the largest oil supply disruption in history, pushing prices to above $100 a barrel.
Global equity markets sold off sharply as the conflict escalated, with momentum stocks and European equities among the hardest hit as investors rotated into energy and safe-haven assets. A 48-hour suspension of strikes beginning 27 March, followed by the tentative Islamabad Accord on 6 April, gave the market room to recover.
Performance of asset classes since 27 Mar 2026
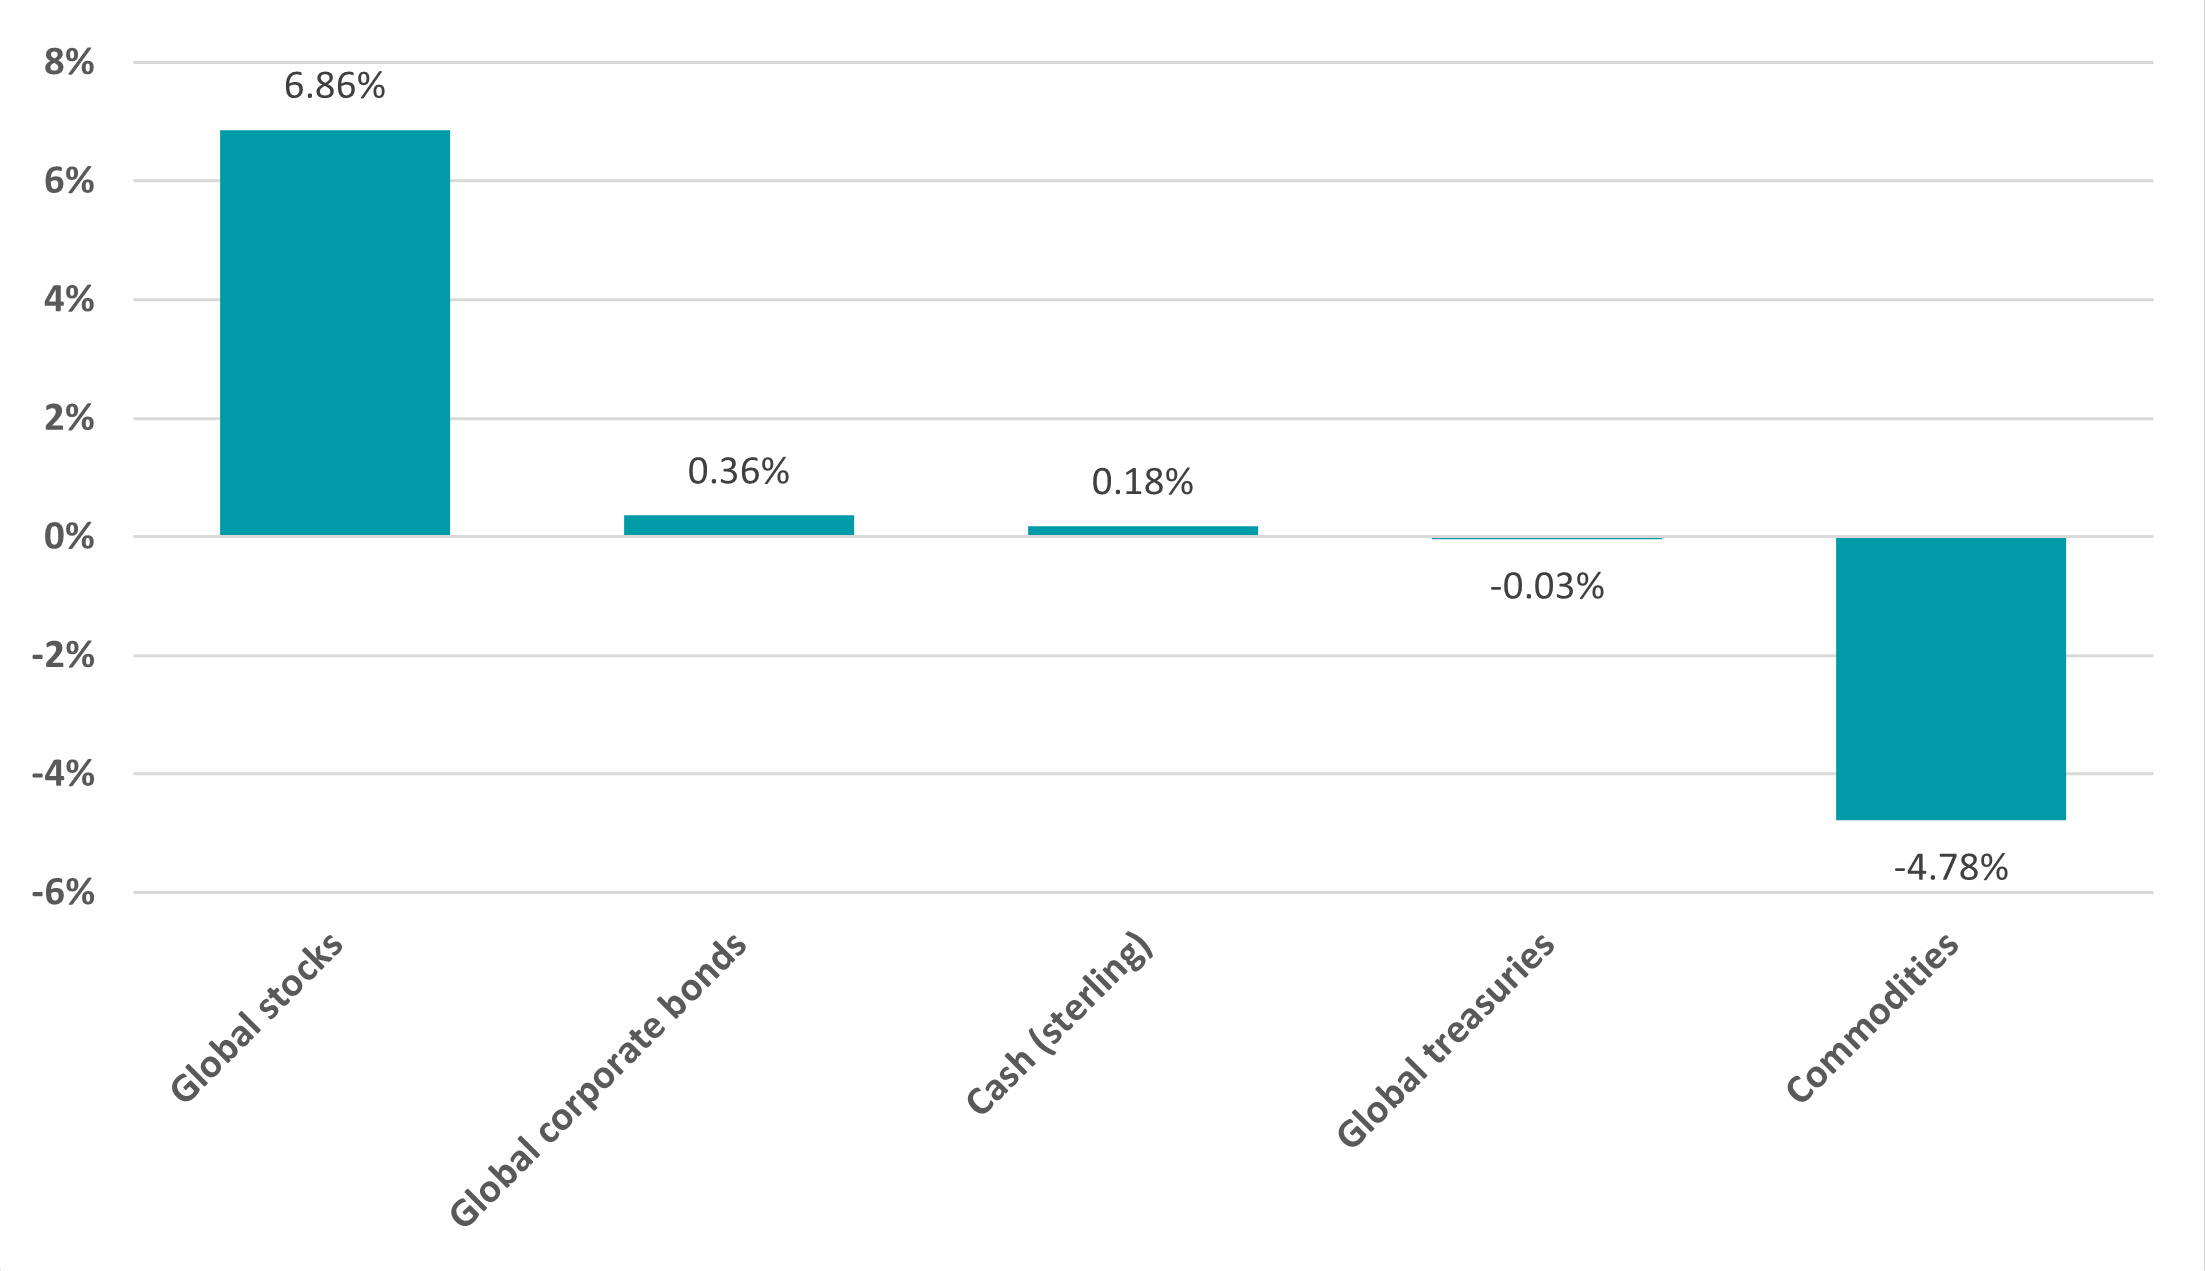
Source: Finxl. Total return in sterling between 27 Mar and 15 Apr 2026
Since 27 March, the MSCI AC World index has gained 6.9% in sterling terms, while commodities (represented by the S&P GSCI index) have fallen by 4.8%. This is a reversal of previous trends, when stocks tanked and commodities surged after the conflict started. This trend is also apparent on a more granular look at markets.
Within global stocks, the MSCI World Momentum index is the best-performing investment factor, with a total return of 10.9% since the ceasefire was announced. March 2026 had been its worst month since the 2008 global financial crisis, analysis by Trustnet found, after falling 10.2%.
Conversely, energy stocks have been the worst-performing global industry post-ceasefire, with the MSCI World Energy index shedding 8.7% as the oil price has come down from the highs it reached during the conflict.
Gold – which had been selling off despite the geopolitical backdrop seeming like it would be in its favour – has gained 5% since 27 March.
Peter Spiller, manager of Capital Gearing Trust, said: “One thing can be said, which is that the reaction of gold to an actual crisis in the form of the Iran War has been quite disappointing. So, it was negatively correlated on a daily basis with the oil price and positively correlated with the Nasdaq. At least in the short term, it had become a risk-on asset.
“Some of this may have been a general scramble for liquidity in difficult times. But nevertheless it called into question the motive for holding gold. It is fair to say that gold now trades in response to technical analysis rather than any fundamental judgement. We do not know what the future price of gold will be any more than we know what the future price of Bitcoin will be. But it is clear that it is not a secure haven in times of trouble.”
European stocks had also been hit hard during the conflict as investors worried about the impact of higher energy costs and took profits on previously strong assets, but have outperformed in recent days. However, the same cannot be said of UK, emerging market and Japanese stocks, which had been in similar boats to Europe.
Performance of fund sectors since 27 Mar 2026
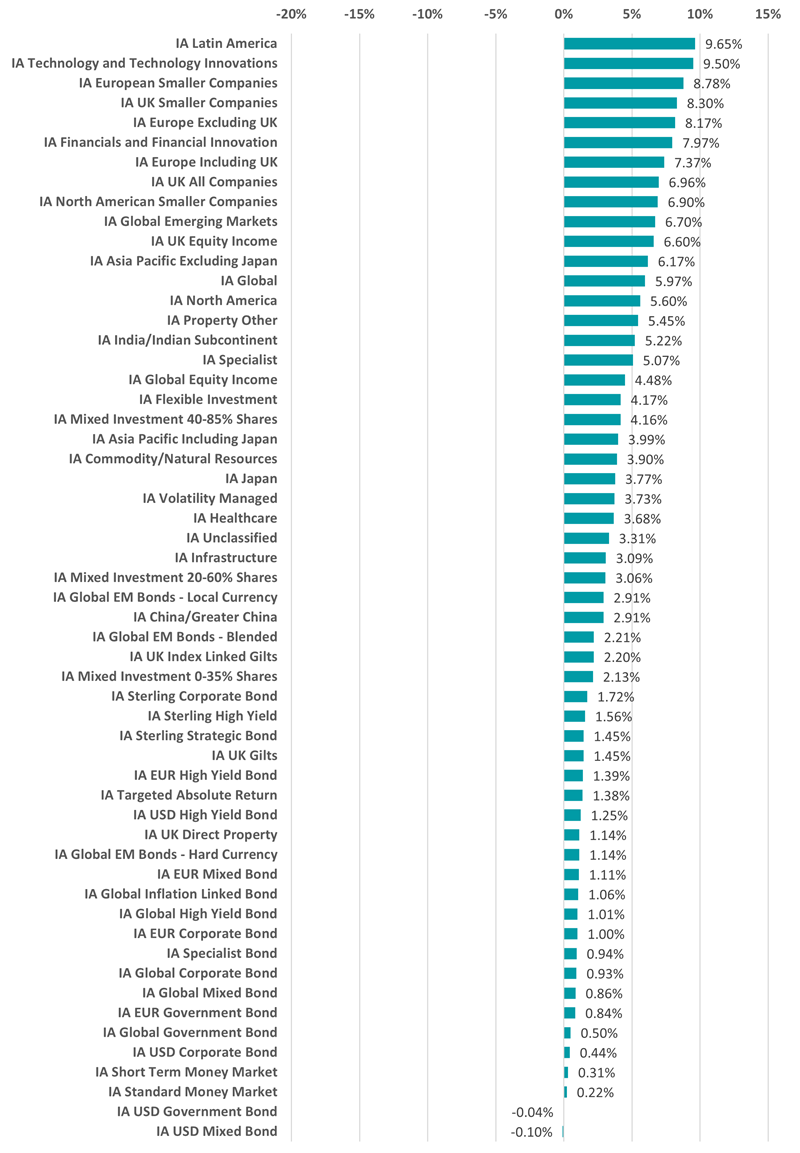
Source: Finxl. Total return in sterling between 27 Mar and 15 Apr 2026
Since 27 March, the best-performing sector in the Investment Association universe has been IA Latin America, where the average fund has gained 9.7%. Latin American stocks have benefitted from the falling oil price and the weaker US dollar.
The best performers in the peer group are iShares MSCI EM Latin America UCITS ETF (up 10.3%), Liontrust Latin America (10.1%) and Barings Latin America (9.8%).
IA Technology & Technology Innovation is in second place with an average return of 9.5%, led by Amundi MSCI Semiconductors (up 17.4%), Liontrust Global Technology (16.6%) and Polar Capital Global Technology (16.5%).
Tech stocks had sold off during the conflict, but not as much as some other areas. Some analysts have said that this is now an attractive entry point after the Iran sell-off blew the froth off the valuations of the more expensive tech names.
The three European equity sectors can be found towards the top of the best-performing peer groups, with Premier Miton European Opportunities (up 17.1%), State Street SPDR MSCI Europe Industrials UCITS ETF (12.2%), State Street SPDR MSCI Europe Financials UCITS ETF (11.9%), CT European Select (11.7%) and CT Select European Equity (11.7%) boasting the highest returns.
| The funds with the highest returns under the Iran ceasefire | ||||
| Fund | Sector | Total return | ||
| Kon-Tiki Verdipapirfond | IA Global | 22% | ||
| Global Verdipapirfond | IA Global | 21% | ||
| WS Amati Strategic Metals | IA Commodity/Natural Resources | 21% | ||
| Quilter Investors Precious Metals Equity | IA Specialist | 19% | ||
| BlackRock Gold & General | IA Specialist | 19% | ||
| Liontrust Russia | IA Specialist | 18% | ||
| WisdomTree Blockchain UCITS ETF | IA Global | 18% | ||
| SVS Baker Steel Gold & Precious Metals | IA Specialist | 18% | ||
| Ninety One Global Gold | IA Specialist | 18% | ||
| NB Next Generation Connectivity | IA Specialist | 18% | ||
| Amundi MSCI Semiconductors | IA Technology & Technology Innovation | 17% | ||
| Premier Miton European Opportunities | IA Europe Excluding UK | 17% | ||
| UBS Solactive Global Pure Gold Miners UCITS ETF | IA Commodity/Natural Resources | 17% | ||
| YFS Charteris Gold and Precious Metals | IA Commodity/Natural Resources | 17% | ||
| Liontrust Global Technology | IA Technology & Technology Innovation | 17% | ||
| Polar Capital Global Technology | IA Technology & Technology Innovation | 16% | ||
| Jupiter Gold And Silver | IA Specialist | 16% | ||
| SVS Baker Steel Electrum | IA Commodity/Natural Resources | 16% | ||
| Barings Eastern Europe | IA Specialist | 16% | ||
| WisdomTree Quantum Computing UCITS ETF | IA Technology & Technology Innovation | 16% | ||
| WisdomTree Strategic Metals and Rare Earths Miners UCITS ETF | IA Commodity/Natural Resources | 15% | ||
| JPM Emerging Europe Equity II | IA Unclassified | 15% | ||
| Schroder ISF Emerging Europe | IA Specialist | 15% | ||
| AB International Technology Portfolio | IA Technology & Technology Innovation | 15% | ||
| Invesco CoinShares Global Blockchain UCITS ETF | IA Global | 15% | ||
Source: Finxl. Total return in sterling between 27 Mar and 15 Apr 2026
On individual funds, the two strongest post-ceasefire strategies are run by Norwegian asset management house Skagen: Kon-Tiki Verdipapirfond and Global Verdipapirfond, both of which have made more than 20% since 27 March.
Kon-Tiki Verdipapirfond, which is managed by Fredrik Bjelland and Espen Klette, is a value-based emerging markets equity fund, despite residing in the IA Global sector. Global Verdipapirfond is a global equity strategy, with managers Knut Gezelius and Midhat Syed looking for undervalued “structural winners”.
Funds that invest in ‘strategic’ or precious metals – such as WS Amati Strategic Metals, Quilter Investors Precious Metals Equity and BlackRock Gold & General – are another common theme among the funds making the highest returns under the Iran ceasefire.
As noted above, gold has rallied since 27 March but it’s not alone: silver has gained more than 10%, copper close to 7%, aluminium around 5.5%, zinc 4.7% and nickel 3.5%. Many of these metals are seen as critical to electrification, defence systems, AI data centres, power grids or battery technology, and all benefit from the decline in the US dollar.
However, some funds have lost money since the conflict was paused, with the most common theme being a focus on energy stocks. Xtrackers MSCI USA Energy UCITS ETF is down the most, losing 10.8%, followed by State Street SPDR S&P U.S. Energy Select Sector UCITS ETF, iShares S&P 500 Energy Sector UCITS ETF, iShares Oil & Gas Exploration & Production UCITS ETF and GS North America Energy & Energy Infrastructure Equity Portfolio.