


Despite a positive start to 2020, markets crashed in March as the Covid-19 coronavirus spread around the world forcing lockdowns and disruption to numerous industries. Enforced lockdowns and social distancing measures created a clear divide of winners and losers.
However, investors continued to invest during 2020, taking advantage of the March sell-off and unprecedented sums pumped into economies by governments and central banks around the world.
One of the ways they did this was through exchange-traded funds (ETFs). Indeed, consultancy ETFGI reported $670.6bn in inflows to exchange-traded products (ETPs) in the year to end-November.
Below, Trustnet used data from FE Analytics to find out which were the best performing sectors in the wider ETF universe, and then narrowed down the search to find the best and worst performing ETFs available to the UK investor.
Top five best performing sectors

Source: FE Analytics
The best performing sector overall was the Gbl ETF Equity Korea, with a total return of 37.21 per cent.
South Korea, not too dissimilar from other south-east Asian countries, dealt with the pandemic well and its economy recovered after the initial outbreak. Its exposure to technology stocks, such as mega-cap Samsung Electronics, also contributed to stronger performance.
The top performing fund within the sector was the Franklin – FTSE Korea UCITS ETF which posted a total return of 45.05 per cent.
Moving on, the Gbl ETF Equity Tech Media & Telecom sector came in a close second, reflecting the strong performance of technology companies in a year in which people relied upon technology to work from home, to shop and to keep themselves entertained.
This also boded well for US equity trackers, where many of the key tech beneficiaries were based, with the Gbl ETF Equity North America sector return 22.40 per cent.
Top five worst performing sectors

Source: FE Analytics
The worst performing sector over 2020 was Gbl ETF Equity Latin America, which posted a loss of 17.61 per cent for the year. Unsurprising, perhaps, considering that Brazil makes up a large proportion of the sector and has struggled with cases of Covid-19 since March.
The Gbl ETF Equity – Emerging Europe sector is the second-worst performer with a loss of 16.01 per cent for 2020. However, the sector only contains three funds which track the MSCI Eastern Europe ex Russia index – a blend of equities from Poland, Hungary and Czech Republic.
Two property sectors follow in the worst performers, Gbl ETF Property Asia and Gbl ETF Property International both posted losses for 2020 after a difficult year for commercial property.
Finally, the Gbl ETF Equity UK sector made a loss of 7.34 per cent as the country struggled to grapple with cases of Covid-19 and the continuing uncertainty surrounding Brexit.
Looking across the entire Global ETF universe, leveraged strategies and cryptocurrency ETFs were amongst the top performers of 2020.
However, looking at ETFs available to UK investors there were some interesting performances to note.
Top 20 performing ETF funds of 2020

Source: FE Analytics
At the top of performers was the Leverage Shares 2x Nvidia ETP – a strategy aiming to deliver twice the daily return of US technology company Nvidia – which posted a return of 228.14 per cent for 2020.
Second is the GraniteShares 3x Short Lloyds Banking Group Daily ETP with a total return of 198.09 per cent, an ETF aiming to deliver -3 times the daily return of the UK-listed bank. (i.e. if Lloyds Banking Group rises by 1 per cent over a day, then the ETP will fall by 3 per cent and vice versa).
Such leveraged and shorting strategies – primarily intended for professional investors – can be found at the top and the bottom, particularly as there were quite polarised winners and losers during the pandemic.
Elsewhere, the $43.9m Xtrackers Physical Rhodium ETC (an exchange traded commodity) is third out of the top performers returning 174.47 per cent.
Sourced from mines in South Africa, Rhodium is mainly used in catalytic converters in vehicles to help remove pollutants from exhausts. Prices doubled in 2020 amid tight supply, but analysts doubt there will be a flood of new output from miners given that it’s a specialist area.
Other more prominent trends were evident as ETFs tracking areas such a cloud computing, blockchain, artificial intelligence and eSports all had a high level of returns in 2020.
The WisdomTree Cloud Computing UCITS ETF seeks to track the price of the BVP Nasdaq Emerging Cloud index and made a total return of 103.21 per cent. The $473.6m fund contains Cloudflare, Zoom and Slack within its top holdings.
One interesting addition is the $97m L&G Healthcare Breakthrough UCITS ETF, which made 60.61 per cent for 2020. Considering the importance of technology in the development of Covid-19 vaccines, healthcare breakthroughs will increasingly be looked to in dealing with future pandemics.
Worst 20 performing ETF funds of 2020
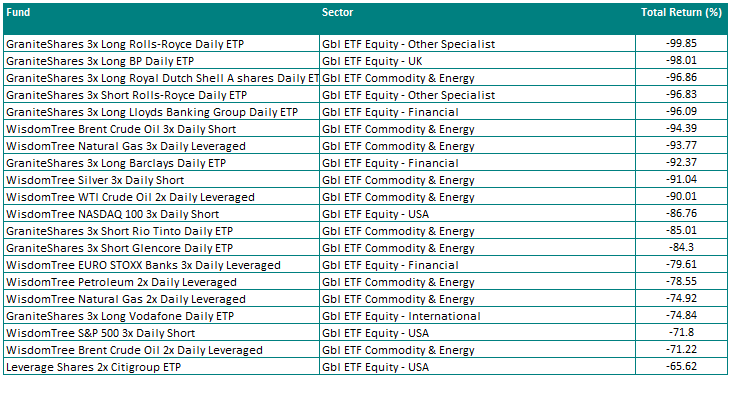
Source: FE Analytics
More company-specific leveraged plays dominated the bottom of the performance table as several industries were challenged by the coronavirus and its impact on the global economy.
Indeed, leveraged strategies focused on Royal Dutch Shell, BP and Rolls-Royce stood out.
A difficult year for aerospace engineer Rolls-Royce, as air travel was disrupted by Covid-19 restrictions, resulting in heightened share price volatility. The GraniteShares 3x Long Rolls-Royce Daily ETP was down by 99.85 per cent.
It should be remembered that many such short and leveraged strategies are reset daily, and can erode returns.
In what was also a difficult year for the oil & gas industry, as a short oil price war was sparked between Russia and OPEC and followed by the outbreak of Covid-19, leveraged strategies recorded quite large losses.
The WisdomTree Petroleum 2x Daily Leveraged ETF and WisdomTree Natural Gas 2x Daily Leveraged ETF lost 78.55 and 74.92 per cent respectively.