


A contrarian buying opportunity has opened up in Indian mid caps, according to David Cornell, chief investment officer at Ocean Dial, who says his India Capital Growth trust can make up to 40 per cent from its current level if its holdings return to fair value.
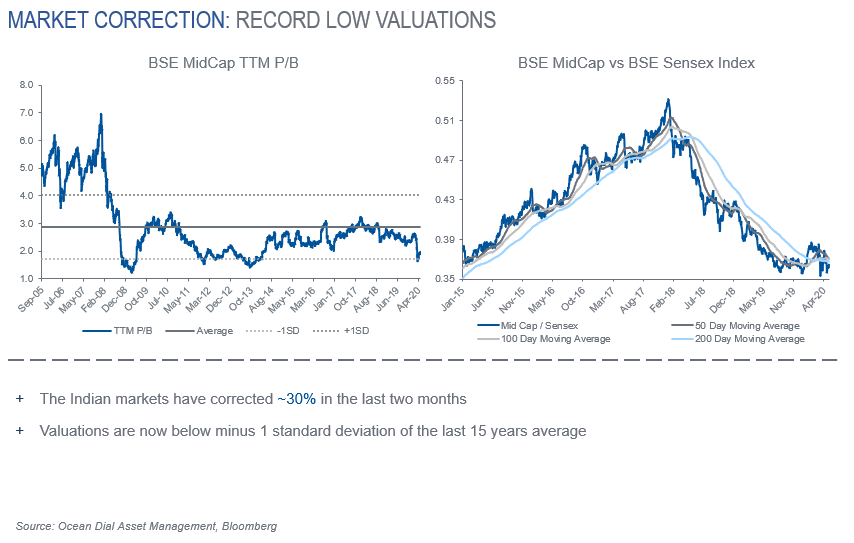
The lockdown in India is the world’s largest, limiting the movement of approximately 1.4 billion people, and it is no surprise that its stock market is down 25 per cent from this year’s peak.
Yet the mid cap area of the market fell out of favour long before the coronavirus outbreak – it was down by about 30 per cent between its peak in 2018 and the start of 2020 – and this is where Cornell said the contrarian buying opportunity comes in.
“If you look at it today, you can see that the Covid-related collapse has been pretty much across the board, the point being that small and mid caps have fallen another 20 per cent, but from a much lower base than large caps,” he explained.
“So really the opportunity for them to fall further from here relative to large caps looks pretty small to us.
“There have now been four times in the last 15 years when Indian mid caps have been more than one standard deviation below their long-term average. The last [before today] was 2013, then prior to that 2012 and then the financial crash in 2008 to 2009. From a historic valuation perspective, we think it looks pretty cheap and that it can re-rate from here.”
Like every other fund manager at the moment, Ocean Dial is struggling to get a handle on future corporate earnings and profitability in light of the coronavirus lockdown. In an attempt to work out the fair value of India Capital Growth’s portfolio holdings, its team used a target multiple one standard deviation below their long-term average based on historical earnings. Even in the worst-case scenario, Cornell said the results from this experiment were encouraging.
“On the most bearish or conservative estimates there is a 16 per cent upside,” he continued. “And if we were to use our fair value multiple assumption, that’s a 38.3 per cent upside.”
While such a prediction may sound optimistic, the chief investment officer said such gains have not been beyond the reach of the trust in the past.
“The best period for returns was 2014 to 2017 when the portfolio was trading at a P/E [price-to-earnings multiple] of 15.6x and the net asset value compounded at an average of 44 per cent a year for three years. It is trading at around 15.6x today.
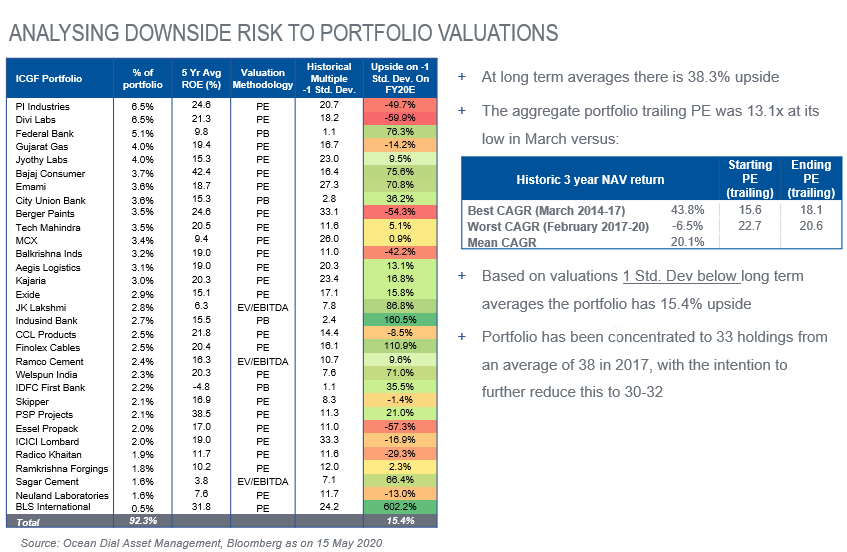
“If you look at the worst period, which is February 2017 to February 2020, the last three years, you can see the trailing P/E was much more expensive then. Our view is that if you take the worst-case scenario it looks pretty much priced in to us.”
India Capital Growth has trailed behind its BSE Mid Cap Total Return Index in the recent past and if, as seems likely, the trust fails to arrest this underperformance by August, a continuation vote will be triggered.
The board has put together a set of proposals to shareholders which it recommended they take, pointing out it would be unwise to wind up the trust while valuations are close to historic lows.
These include a change in the management fee, the introduction of a redemption facility and steps to improve performance, which the board admitted has been below par.
“The underperformance has come through some stockpicking errors, particularly in the financial sector, but also in stocks which have been exposed to consumption, specifically in rural India,” Cornell continued.
“We saw a big de-rating in these following the default of a major lending institution in India in 2018. And that led to a liquidity crisis and a solvency crisis, which impacted the banks and rural India. We saw a big slowdown in top line growth in the rural companies in the portfolio, and the asset quality of the banks deteriorated meaningfully.
“We had a couple of stock-specific issues in those two sectors. It’s pretty much always the case one or two stocks [Yes Bank and beverage maker Manpasand] are responsible for the damage to the entire portfolio and in our case it was no different.”
However, Cornell believes the steps taken by the board will prevent a repeat of these mistakes. The investment team has three new members, with each analyst responsible for no more than 30 stocks, while the portfolio managers can now only buy companies from a list of 143 names that have been pre-approved from a qualitative and quantitative basis.
Where problems arose before, according to the chief investment officer, was not so much in buying the wrong stocks, but in failing to sell them.
“The issue was about the reluctance to respond to some of the macro events around the default of IL&FS or the onset of Covid, but I think a lot of those issues have been solved now,” he explained.
“Analysts can go deeper into stocks to ensure that we don’t fall into the same trap that we’ve fallen into before, which is really a lack of sell discipline. We have also created a ranking tool of those 143 companies, so we are able to identify our expectation of upside potential to fair value on a bunch of different valuation metrics.
“What this does is it helps the portfolio managers to see their invested companies relative to others in the universe. If you have a stock that’s done well, which Yes Bank had, it would be in the bottom quadrant of the ranking tool because the expectation of upside to value would have been pretty low.
“You could see other stocks in the sector were much more attractive. So it’s a tool designed to reduce behavioural emotional issues, particularly around stocks we have owned for a long time, and trigger better sell disciplines.”
Data from FE Analytics shows India Capital Growth is down 20.09 per cent over the past 10 years, compared with gains of 42.45 per cent from the MSCI India Mid Cap index.
Performance of trust vs index over 10yrs
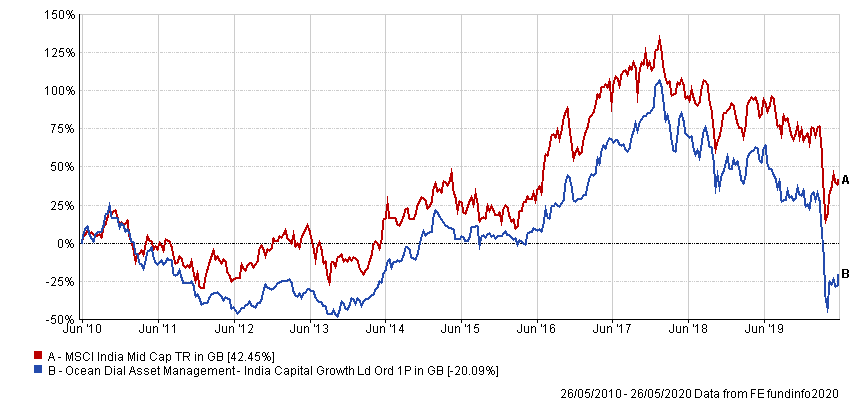
Source: FE Analytics
The trust has ongoing charges of 1.25 per cent of total assets (this figure is under review) and is trading at a discount of 27.25 per cent to net asset value (NAV) compared with 20.38 and 15.66 per cent from its one- and three-year averages. It is not currently geared.