


A shift in global risk appetite defined fund flows into Asia Pacific and emerging markets in 2025.
Liberation Day in April set the tone of the year, as investors increasingly sought diversification away from the US and explored their options across fast-growing regions.
Yet Asia Pacific and emerging markets are far from a single story, with each market charting its own path – with differing levels of success.
Below, Trustnet used FE Analytics flows data to examine where investors moved their money across the IA Global Emerging Markets, IA Asia Pacific including Japan, IA Asia Pacific ex Japan, IA Japan, IA China/Greater China and IA India/Indian Subcontinent sectors in 2025.
We focused on unit funds and OEICS only, highlighting which attracted or lost at least £200m.
IA Global Emerging Markets
Emerging markets have long carried a reputation for unpredictability, shaped by political risk, weaker institutions, narrower economic structures and currency volatility. Even so, the sector outpaced all others examined in this article, posting the highest average one‑year total return of 21.9%.
Seven funds in the sector took in more than £200m in net new money over the course of 2025.

Artemis SmartGARP Global Emerging Markets Equity received the most net new money over the 12-month period, with investors adding £586.4m. When also factoring in performance – which added £457.4m – the fund’s assets under management (AUM) doubled from £1.1bn in 2024 to £2.2bn by the end of 2025.
Managed by FE fundinfo Alpha Manager Raheel Altaf, it delivered top quartile returns in the sector over three, five and 10 years.
Investors also added £464.6m in net new money to HSBC MSCI Emerging Markets Equity Index in 2025, while performance accounted for £105.7m.
On the sell side, five funds saw withdrawals of at least £200m over the year.
iShares Emerging Markets Equity Index (UK) faced the largest withdrawal in the sector, shrinking from £4.2bn in 2024 to £3.5bn last year, as investors pulled £1.2bn despite the strategy generating a £510.3m performance gain.
The fund maintains significant exposure to China and Taiwan at 33.7% and 22.3% each – two markets that dominated sentiment in 2025, as China staged an uneven recovery and Taiwan’s tech-heavy market remained sensitive to geopolitical tensions and global semiconductor demand.
The Fidelity Emerging Markets fund also saw substantial outflows over the past year. While performance added £242m, investors still withdrew £475.6m, with the overall fund size shrinking from £1.3bn in 2025 to £1bn by the end of 2025.
IA Asia Pacific excluding and including Japan
Turning to the Asia Pacific region, no funds in the IA Asia Pacific Including Asia sector lost or gained more than £200m in 2025.
Invesco Pacific grew from £329.7m in 2024 to £413.5m in 2025, with investors adding around £9m in net new money, while Stewart Investors Asia Pacific and Japan All Cap’s performance lost the fund £26m, with a further £57.7m withdrawn.
When looking at the IA Asia Pacific ex Japan sector, flows were far more pronounced, with multiple funds exceeding the £200m mark for both 2025 inflows and outflows.
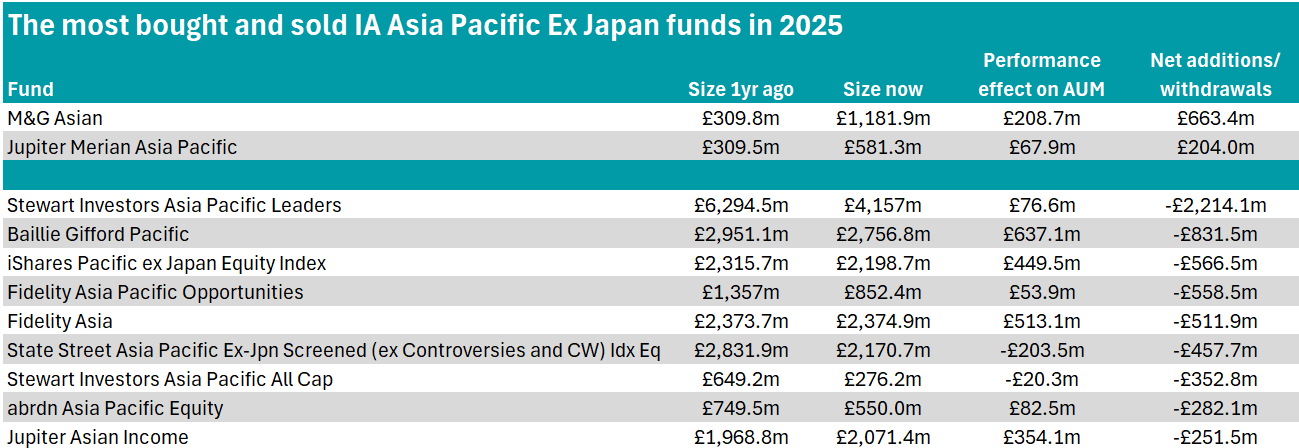
M&G Asian recorded the most inflows in the IA Asia Pacific ex Japan sector in 2025, with its assets ballooning from £309.8m in 2024 to £1.2bn last year. While performance contributed £208.7m, the bulk of the growth came from the £663.4m in net new money.
Jupiter Merian Asia Pacific also logged notable inflows, attracting £204m. Despite this, the strategy itself delivered a third-quartile performance in the sector, adding £67.9m through returns over the one-year period.
In contrast, Stewart Investors Asia Pacific Leaders faced some of the largest outflows, with assets falling sharply from £6.3bn to £4.2bn. Performance added £76.6m but this was massively outweighed by investor withdrawals, which totalled £2.2bn.
The fund’s longer-term track record might have played a role, as it sits in the fourth quartile for returns in the sector over one, three and 10 years, having gained 113.2% over the decade compared with the sector average of 141.6%.
Despite posting a top-quartile return of 28.8%, adding £637.1m in performance, investors withdrew £831.5m from Baillie Gifford Pacific. As such, AUM dipped from just shy of £3bn in 2024 to £2.8bn in 2025.
Despite this short-term record, the fund has excelled over the long term, gaining 263.9% over 10 years, comfortably ahead of the sector average of 141.6%.
IA Japan, IA China/Greater China and IA India/Indian Subcontinent
Over the course of 2025, the IA Japan sector made an average 17.4% gain, while investing in the IA India/Indian Subcontinent sector would have lost investors an average of 8.9%. However, no funds across either sector saw investor inflows reach over £200m in 2025.
In the IA India/Indian Subcontinent sector, M&G India gained £1.6m in net new money in 2025, while in the IA Japan sector, MGTS – Mgts Afh Da Japan Equity and abrdn Japan Equity Tracker managed £187.7m and £179.7m in net new money respectively.
However, when looking at outflows, the numbers are much bigger.
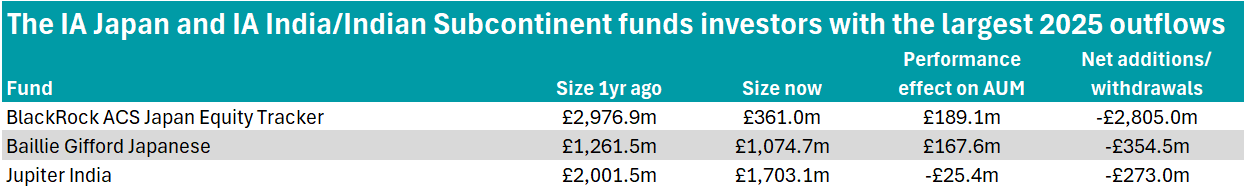
In the IA Japan sector, BlackRock ACS Japan Equity Tracker logged the largest redemptions in 2025, with assets plunging from close to £3bn in 2024 to £361m in 2025, despite generating a £189.1m performance gain.
The Baillie Gifford Japanese fund also experienced significant withdrawals, with assets falling to £1.1bn. A performance gain of £167.6m was overshadowed by £354.5m in investor redemptions.
Meanwhile, 2025 was a tough year for India, with investors put off by high valuations and the region’s more limited exposure to the artificial intelligence surge.
Jupiter India recorded one of the year’s most notable contractions, with assets declining from £2bn in 2024 to £1.7bn in 2025. Performance-wise, the fund made a £25.4m loss, while investors pulled an additional £273m.
Finally, no funds in the IA China/Greater China sector had inflows or outflows greater than £200m. Jupiter China logged the most net new money at £35.4m, while M&G China lost the most at £39.3m.