


European equity funds dominate the performance rankings since the Brexit referendum with just two UK strategies making it into the 25 highest-returning funds across both regions over the past 10 years, FE fundinfo data shows.
The UK voted to leave the European Union on 23 June 2016, with 52% of voters choosing to leave against 48% opting to remain, a result that surprised financial markets and triggered an immediate collapse in sterling. The formal departure took four more years to complete, with the UK leaving the EU on 31 January 2020 and a trade and cooperation agreement governing future relations taking effect on 1 January 2021.
The referendum introduced a decade of structural disruption to both UK and European markets, reshaping trade relationships, corporate investment decisions and currency dynamics in ways that affected returns across the asset class.
FE Analytics shows that European stocks have outpaced the UK over this period: the MSCI Europe ex UK index has made a 183.3% total return (in sterling) over the past 10 years, compared with 141% for the MSCI United Kingdom index.
Performance of indices since the Brexit referendum
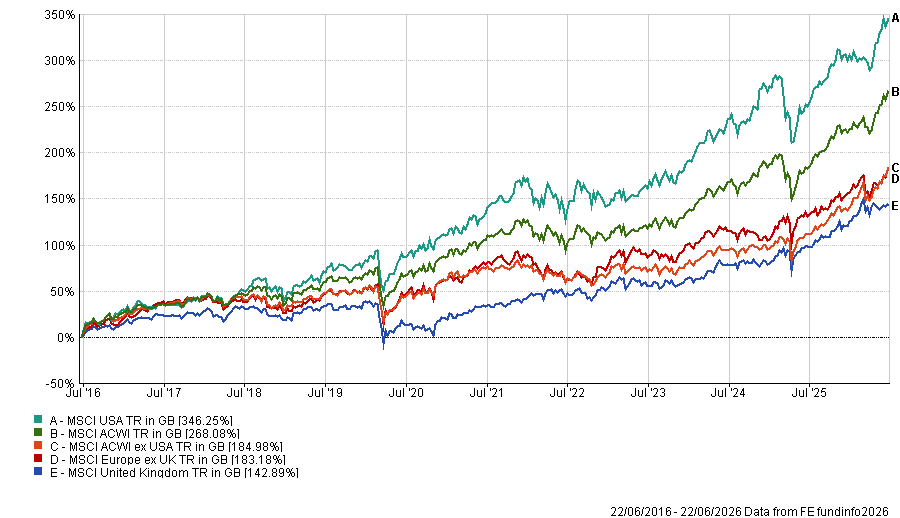
Source: FE Analytics. Total return in sterling between 23 Jun 2016 and 22 Jun 2026
It's worth noting that both have underperformed global equities, with the MSCI AC World gaining 268.9% over the same period, driven by US mega-cap tech stocks. The European index's gain is just a few basis points behind the return of the MSCI AC World ex USA index.
Adrian Murphy, chief executive of Murphy Wealth, conceded that the UK's departure from the EU had contributed to the country's sluggish economic growth, but added that it is "far from the only reason" why the domestic stock market has lagged behind other major indices.
He noted that a large part of the FTSE 100 is made up of financials, energy and resource companies, and pharmaceutical giants, which have been out of favour globally as investors chased the spectacular returns of tech stocks.
"If you were completely invested in the UK over the past decade, you would have found yourself substantially lagging behind global indices. And, partially because of the perceived risk of investing and the seemingly low returns, too many people across the country choose to save their cash rather than invest it," he added.
"That in itself has a knock-on effect for the stock market's performance, which is why the chancellor is taking steps to encourage more people to invest – there are some encouraging early signs on that front, but there is still a long way to go."
Performance of UK and European fund sectors since the Brexit referendum
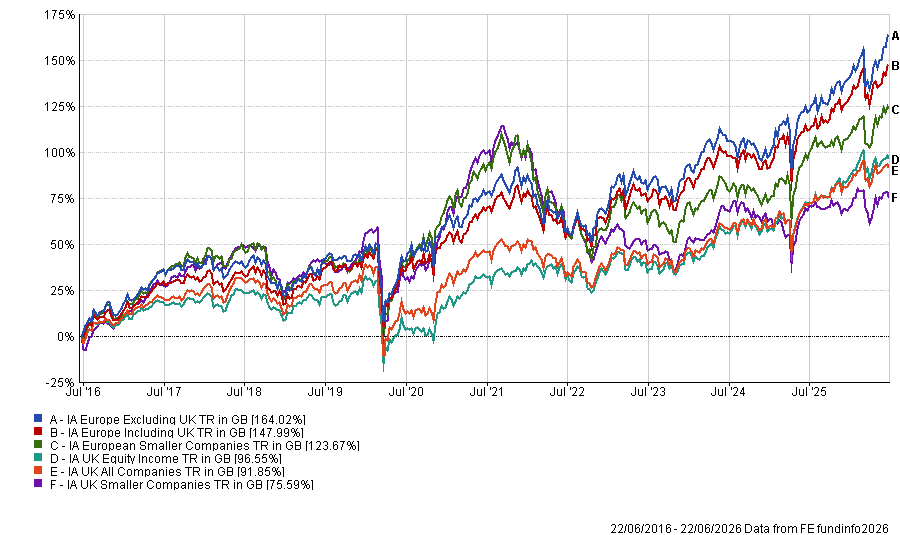
Source: FE Analytics. Average return in sterling between 23 Jun 2016 and 22 Jun 2026
The underperformance is clear in the average returns of the Investment Association's three European equity fund sectors versus the three UK equity peer groups.
As the chart above shows, all three European sectors are significantly ahead of their UK rivals. The performance gap between the flagship IA UK All Companies and IA European Excluding UK peer groups is more than 70 percentage points in favour of the European sector.
To put it into context of the wider Investment Association universe, the IA European Excluding UK is ranked 12th out of 51 for the 10 years under consideration, with IA Europe Including UK in 13th and IA European Smaller Companies in 15th.
The UK peer groups have done better than might be expected: IA UK Equity Income is in 21st place, IA UK All Companies 23rd and IA UK Smaller Companies 24th.
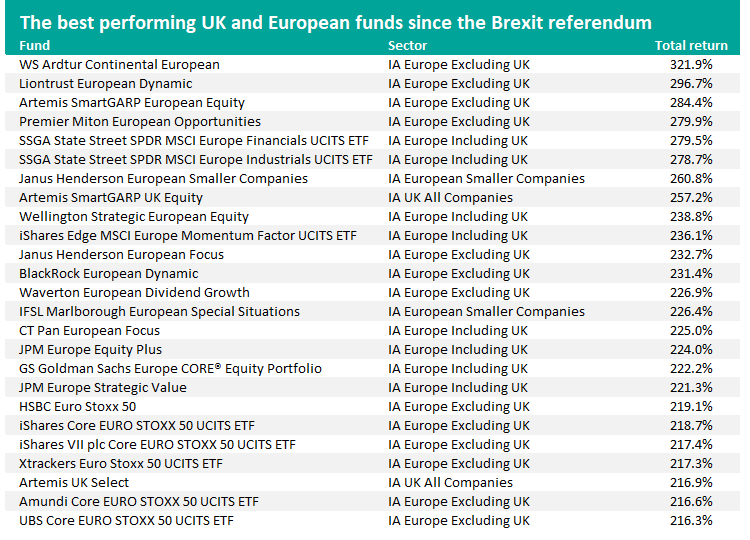
Source: FE Analytics. Total return in sterling between 23 Jun 2016 and 22 Jun 2026
Of the 473 funds with a 10-year track record in those six sectors, the best performer has been WS Ardtur Continental European with a total return of 321.9%. Managed by S.W. Mitchell Capital's Oliver Kelton, the fund is run with a concentrated portfolio of typically 20 to 30 long positions, following a traditional value approach to continental European equities.
The fund targets companies that have been penalised by the prolonged era of loose monetary policy and negative interest rates across Europe, which Kelton argues created an extreme pricing differential between growth and value stocks.
Liontrust European Dynamic is in second place with a 296.7% total return over 10 years. Managers James Inglis-Jones and Samantha Gleave, who both hold FE fundinfo Alpha Manager status, put cashflow yield and cashflow return on assets at the heart of their process, but also pay attention to momentum, quality and value factors, as well as macroeconomics, when choosing stocks.
Artemis SmartGARP European Equity's 284.4% total return put it in third place. FE fundinfo Alpha Manager Philip Wolstencroft created the SmartGARP process in the early 1990s; it scores stocks between one and 100 across eight different factors (growth, valuation, estimate revisions, momentum, accruals, ESG, macro and investor sentiment).
The only two UK equity funds to make it into the 25 highest-returning European or UK funds since the Brexit referendum are also run by Artemis: Artemis SmartGARP UK Equity and Artemis UK Select.
Artemis SmartGARP UK Equity, which is in eighth place with a 257.2% total return, is also managed by Wolstencroft using the same process.
Explaining the strong performance across the SmartGARP range, analysts at Rayner Spencer Mills Research said: "SmartGARP portfolios inherently lean toward undervalued segments of the market, targeting firms with improving earnings and balance sheets poised for long-term growth and re-rating.
"The approach is systematic and data-driven, mitigating biases and maintaining caution during volatile markets or major events, with reduced trading activity as managers reassess portfolio impacts."
Artemis UK Select is managed by Ed Leggett and Ambrose Faulks, who build a concentrated multi-cap portfolio of companies that have growing earnings potential but are undervalued by the market. It is in 23rd place in this research with a 216.9% total return.
But aside from these two funds, you have to go quite far down the rankings to find the next UK strategies. JPM UK Equity Plus is in 77th place with a 184.5% total return, followed by Dimensional UK Value (82nd, 180.4%), Man Income (104th, 172.5%), Redwheel UK Value (105th, 171.9%) and Invesco UK Opportunities (109th, 167.9%).