






Global stock market concentration has spread well beyond the handful of US mega-caps that dominated headlines in recent years, with Schroders' latest research showing the same pattern now appears in emerging markets as well.
Investors have spent recent years treating the Magnificent Seven as the main source of concentration risk but that framing now seems outdated, given how much weight sits in a handful of countries and companies across other regions too.
The clearest evidence sits in emerging markets, Schroders' Equity Lens for July 2026 shows, where two countries and three chipmakers have come to dominate the benchmark.
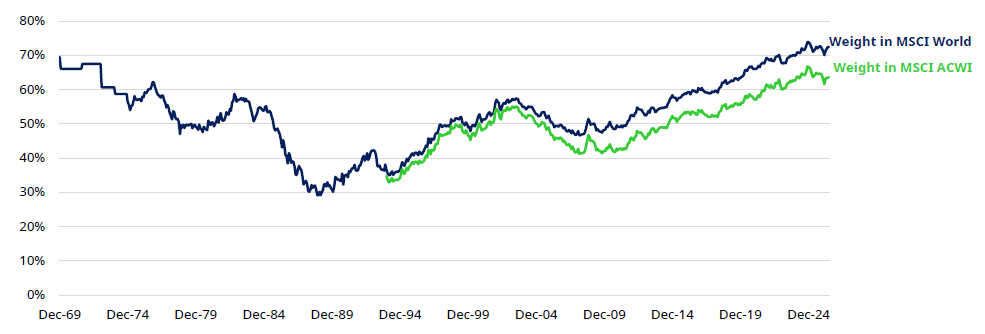
US weight in global benchmarks, since 1969
Source: LSEG Datastream, MSCI, Schroders. Data to 30 Jun 2026
The US share of both the developed-markets MSCI World index and the broader MSCI AC World index has climbed over the past decade, according to Schroders' long-run chart of US index weight. The rise has taken the US share of these benchmarks towards the upper end of its history stretching back to 1969.
This is not a new phenomenon but the scale of the current reading puts today's US weighting among the highest points in more than 50 years of data.
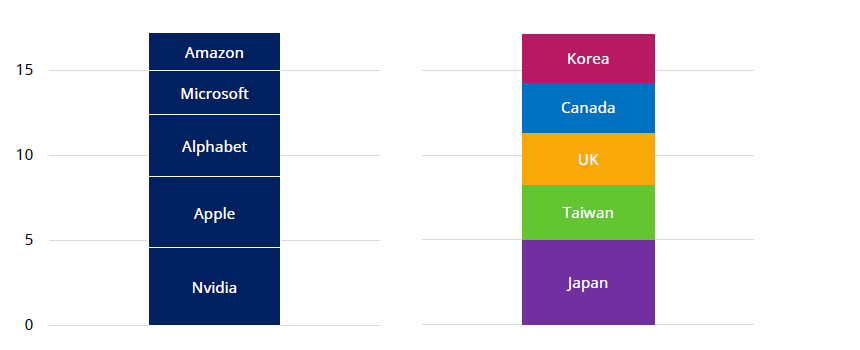
Five US mega-caps vs the next five biggest countries in MSCI AC World
Source: LSEG Datastream, Schroders. Data to 30 Jun 2026
Schroders compared the combined index weight of Nvidia, Apple, Alphabet, Microsoft and Amazon against the combined weight of Japan, Taiwan, the UK, Canada and Korea within the MSCI AC World.
The two totals sit close together: those five companies now carry roughly the same influence over the global index as five entire countries.
This comparison highlights the scale of concentration more directly than country-level weightings alone, as a small number of stock-specific factors now move as much of the global index as issues affecting five national markets combined.
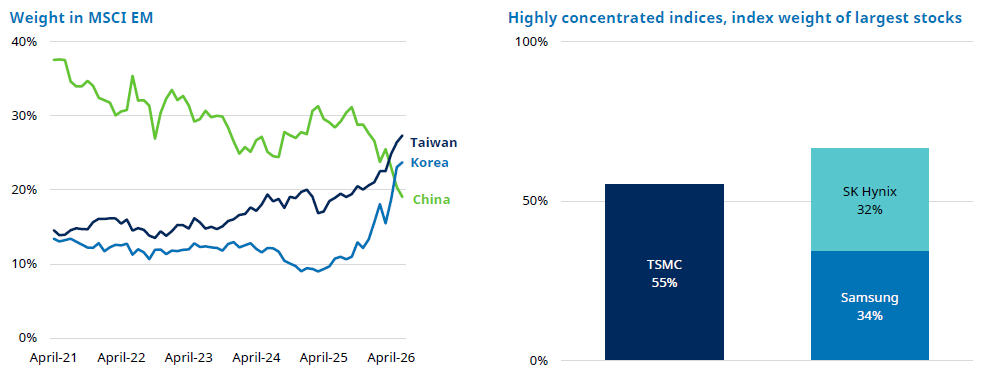
Taiwan and Korea's tech leaders have driven them to overtake China
Source: LSEG Datastream, MSCI, Schroders. Data to 30 Jun 2026
Taiwan and Korea have overtaken China as the largest markets within the MSCI Emerging Markets index, driven by their leading semiconductor companies.
China previously held the largest single-country weight in the MSCI Emerging Markets index but the shift has been driven almost entirely by a handful of chip manufacturers rather than a broader rotation across emerging market sectors.
Taiwan Semiconductor Manufacturing Company accounts for 55% of Taiwan's weight in the index, while Samsung and SK Hynix account for 34% and 32% of Korea's weight, respectively, as at 30 June.
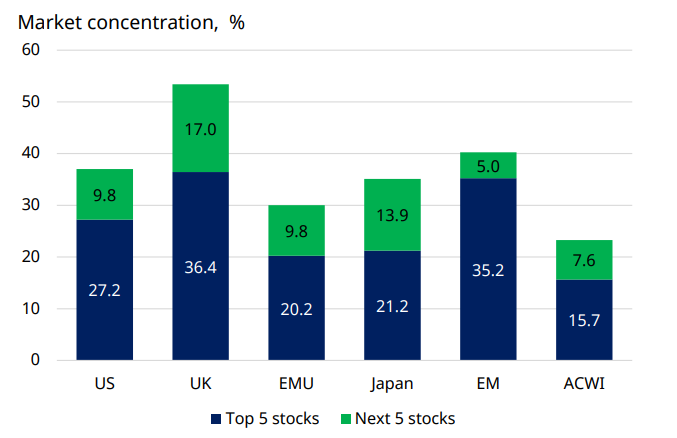
Top five and next five stock weights across major markets
Source: LSEG Datastream, MSCI, Schroders. Data to 30 Jun 2026
Schroders' market concentration chart shows the top five and next five stocks account for a meaningful share of the index in every major market it covers.
This reveals how concentration is not confined to the US or to any single style of index, but shows up in developed and emerging markets alike, once measured at the level of individual stocks rather than sectors or countries.
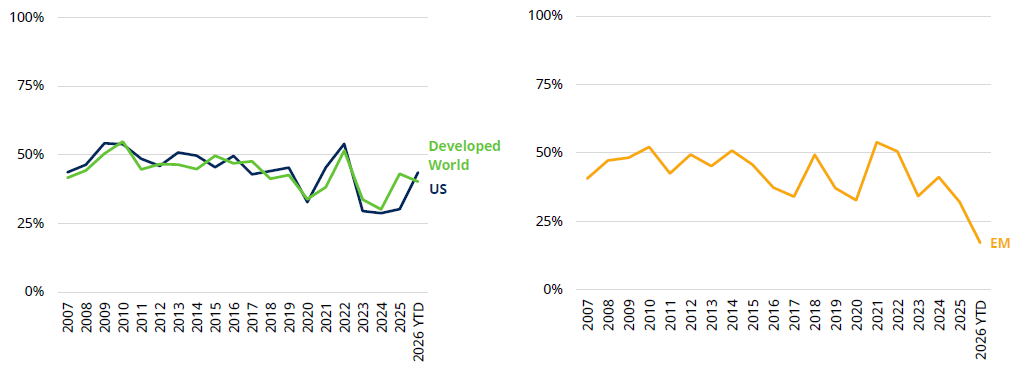
Share of stocks outperforming the index
Source: MSCI, Schroders. Data to 30 Jun 2026
Schroders tracked the percentage of emerging market stocks outperforming the benchmark over time, alongside the equivalent measure for the US and developed world.
The emerging market reading has fallen towards its lowest point in the series shown, even as the index itself has produced strong headline returns.
This breadth measure supports the concentration argument: a narrow group of stocks is generating most of the index return, while the majority of emerging market constituents lag behind it.