






Tatton Global Managed Equity has made the best return in the most aggressive model portfolio sector over the past 10 years, Trustnet research shows, with strategies from Saltus, Quilter, Brooks Macdonald and atomos also ranking highly.
In this research, we've grouped FE fundinfo's six MPS sectors into two broader categories – defensive and growth – to identify the best performers of the past decade. The growth group covers the UK MPS 45%-65% Growth, UK MPS 65%-85% Growth and UK MPS 85%-100% Growth sectors.
The UK MPS 85%-100% Growth sector contains aggressive or equity-focused portfolios, with little to no defensive allocation. In the 65%-85% Growth sector, equities dominate, with a smaller allocation to bonds or alternatives for diversification, while the balanced portfolios in the 45%-65% Growth sector are roughly evenly split between growth and defensive assets, sometimes tilted towards growth.
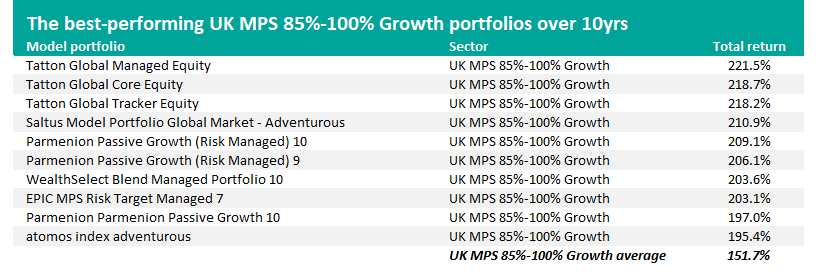
Source: FinXL. Total return in sterling between 1 Jul 2016 and 30 Jun 2026.
Starting with the UK MPS 85%-100% Growth sector, the best performer of the past 10 years was Tatton Global Managed Equity with a total return of 221.5%. This compares with an average return of 151.7% from the peer group.
Tatton Global Managed Equity sits within Tatton's Managed Portfolios range. It has around 98% in stocks with the small remainder in cash. This is Tatton's highest risk category, suited to a minimum eight-year time horizon.
The range takes a mainly active approach with Tatton's investment team selecting funds run by managers whose strategies fit its view of the global economy. The team reviews and adjusts these choices through a six-stage process, covering fund research, setting the strategic and tactical asset mix, building the portfolio and ongoing monitoring.
It currently has around two-thirds of its assets in US equities. Here, the passive HSBC American Index is its largest holding, surrounded by active funds Jupiter Merian North American Equity, BNY Mellon US Equity Income, SVS AllianceBernstein Concentrated US Equity and Artemis US Select.
The firm also has the second- and third-placed model portfolios in the sector.
In third place is Tatton Global Tracker Equity with a total return of 218.2%. The Tracker range is managed in the same way as the firm's other portfolios but they use passive rather than actively managed funds, meaning they have much lower charges.
In second place is Tatton Global Core Equity with a 218.7% return. The Core range is a mix of passive and actively managed funds, which Tatton said "marries the advantages of both passive and active strategies during investment cycles and reduces overall cost".
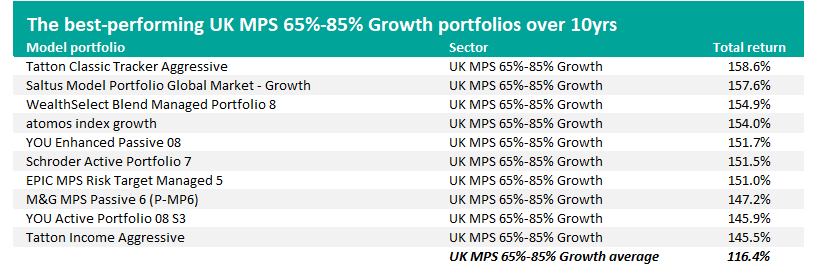
Source: FinXL. Total return in sterling between 1 Jul 2016 and 30 Jun 2026.
Tatton also has the top model portfolio in the UK MPS 65%-85% Growth sector: Tatton Classic Tracker Aggressive, with a 158.6% return.
This portfolio takes Tatton's Classic approach, which has a higher weighting to UK stocks than the Global version. This means it has 42.8% in North American equities with 22.3% in UK stocks.
Its largest holdings are Vanguard US Equity Index, HSBC American Index and Vanguard FTSE Developed Europe ex-UK Equity Index, with iShares UK Equity Index and Invesco UK Enhanced Index also in the top 10.
In second place in the UK MPS 65%-85% Growth sector is Saltus Model Portfolio Global Market – Growth, with a 157.6% return over 10 years.
Saltus runs the portfolio to a fixed asset allocation of 80% equities and 20% fixed income, sitting in the firm's Risk Band 4 (Growth). It invests directly in a range of externally managed funds rather than running money in-house.
The approach is built around factor investing. Saltus aims to avoid bias towards any single asset class, country or style, and instead identifies factors, such as value, that it believes drive returns, then tilts exposure towards them using low-cost index funds. The firm also spreads holdings widely to reduce reliance on any one factor, while keeping costs low.
Global developed market equities make up the bulk of the portfolio through holdings like Vanguard FTSE Developed World ex-UK Equity Index, UBS FTSE RAFI Developed 1000 Index, L&G International Index Trust and abrdn World Equity Enhanced Index.
Quilter's WealthSelect Blend Managed Portfolio 8 is next with a 154.9% return. The portfolio aims for capital growth over five years or more through a diversified mix of UK and global investments, targeting a set range of volatility rather than a fixed asset split.
It holds mainly equities, with around 56% in developed markets outside the UK and 19% in UK equities, alongside smaller weightings in emerging markets and alternatives such as absolute return and dynamic bond funds.
Quilter runs the portfolio using a wide range of external fund managers, blending index-tracking building blocks with actively managed Quilter Investors funds run by names such as BlackRock, Jupiter and Janus Henderson. Its largest single holding is iShares North American Equity Index at 19.2%, followed by iShares UK Equity Index at 9.3%.
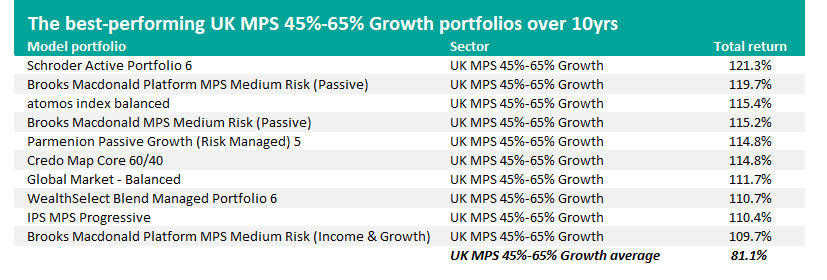
Source: FinXL. Total return in sterling between 1 Jul 2016 and 30 Jun 2026.
Schroder Active Portfolio 6 tops the UK MPS 45%-65% Growth sector with a 10-year return of 121.3%. It sits in the middle of Schroder's nine-strong Active Portfolio range and targets risk level 6, aiming to keep volatility between 65% and 80% of that of global stock markets over a rolling five-year period.
The portfolio takes an active approach, investing worldwide across equities, bonds, currencies and alternative assets such as absolute return strategies. Around 60% sits in equities, with a further 23% in alternatives and the remainder split between bonds and cash, giving it a fairly even balance between growth and defensive holdings.
Rather than holding underlying funds directly, it invests through a layer of Schroder's own regional and asset-class model portfolios, such as Schroder MPS North America Equity and Schroder Alternative Portfolio. These sub-portfolios then hold funds run by external managers including Artemis, JPMorgan and T. Rowe Price.
Brooks Macdonald Platform MPS Medium Risk (Passive), in second place with a 119.7% return, is built from index-tracking funds to keep costs down. The portfolio aims to deliver a mix of income and capital growth, with equity exposure typically running between 55% and 75%.
At medium risk, it currently holds around 63% in equities, with the largest slices in UK and international/thematic funds, at 22% each, alongside North American, European and Asian holdings. The remaining 37% sits mainly in fixed interest, split between UK and international bonds, plus a smaller allocation to alternatives and cash.
Rather than rebalancing to a fixed timetable, Brooks Macdonald's multi-asset team reviews and adjusts the portfolio at its own discretion, based on its read of market conditions.
The UK MPS 45%-65% Growth sector's third-best model portfolio over 10 years is atomos index balanced, up 115.4%. Atomos aims to increase return potential over the long term rather than prioritise capital protection; investors are expected to hold for at least five years and to accept short-term swings in value in exchange for better long-term returns.
The portfolio is built from index-tracking funds, with its largest weighting in North American shares at around 35%, followed by smaller allocations across the UK, Europe, Japan, Asia Pacific and emerging markets. The remainder sits in government and corporate bonds, high yield debt and a modest allocation to property, infrastructure and other alternatives.