


Multi-asset funds such as BNY Mellon Multi-Asset Balanced, Jupiter Merlin Balanced Portfolio and M&G Episode Growth have consistently outperformed their IA Mixed Investment 40-85% Shares peers on a range of performance measures in recent years, research by Trustnet shows.
In this annual series, we examine the major Investment Association sectors through a variety of lenses to see which funds have consistently delivered for investors. This week we’re looking at the IA Mixed Investment 40-85% Shares sector.
We have worked out the percentile rankings of each fund for: cumulative three-year returns to the end of 2023 as well as the individual returns of 2021, 2022 and 2023 (to ensure performance isn’t down to one standout year), annualised volatility, alpha generation, Sharpe ratio, maximum drawdown and upside and downside capture relative to the sector average.
The 10 percentile rankings for these metrics are then collated into an average percentile score for each fund; the lower the score, the stronger a fund has been across the board over the past three years.
Performance of Nedgroup Global Flexible vs sector and index over 3yrs to end of 2023
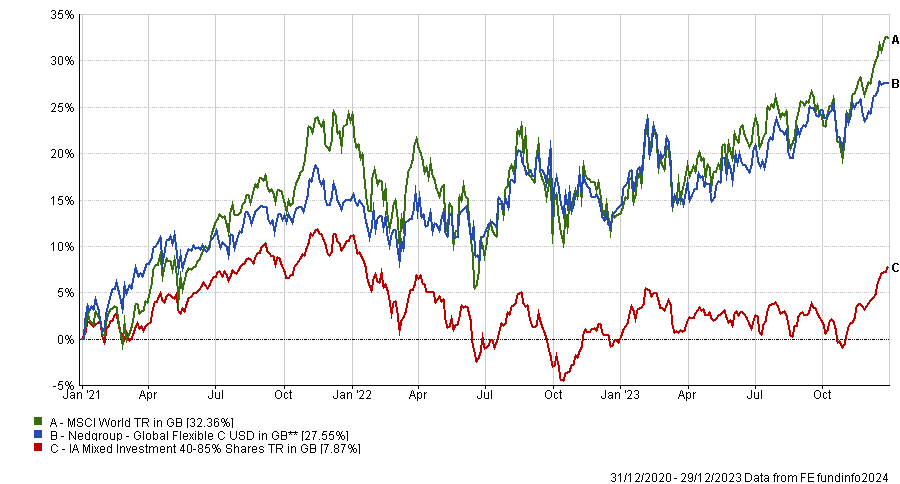
Source: FE Analytics
The fund shown in the chart above has come in first place: Nedgroup Global Flexible has an average percentile score of 9.4 thanks to one of the peer group’s best three-year returns combined with high alpha and Sharpe ratio. It also has one of the lowest maximum drawdowns.
The £866m portfolio is run by sub-investment manager FPA, whose contrarian value team specialises in finding value stocks with a high margin of safety. The investment approach is based on minimising risk to avoid the permanent loss of capital.
This has resulted in portfolio that is biased towards stocks, especially those in the US (top holdings include Alphabet, Comcast, Meta Platforms and Citigroup) with less than 2.5% of assets in fixed income. However, there is a 37.2% weighting to cash.
Despite its large size and strong track record, Nedgroup Global Flexible is not widely available in the UK although – as can be seen in the table below – other IA Mixed Investment 40-85% Shares funds that have done well in this research are better known here.
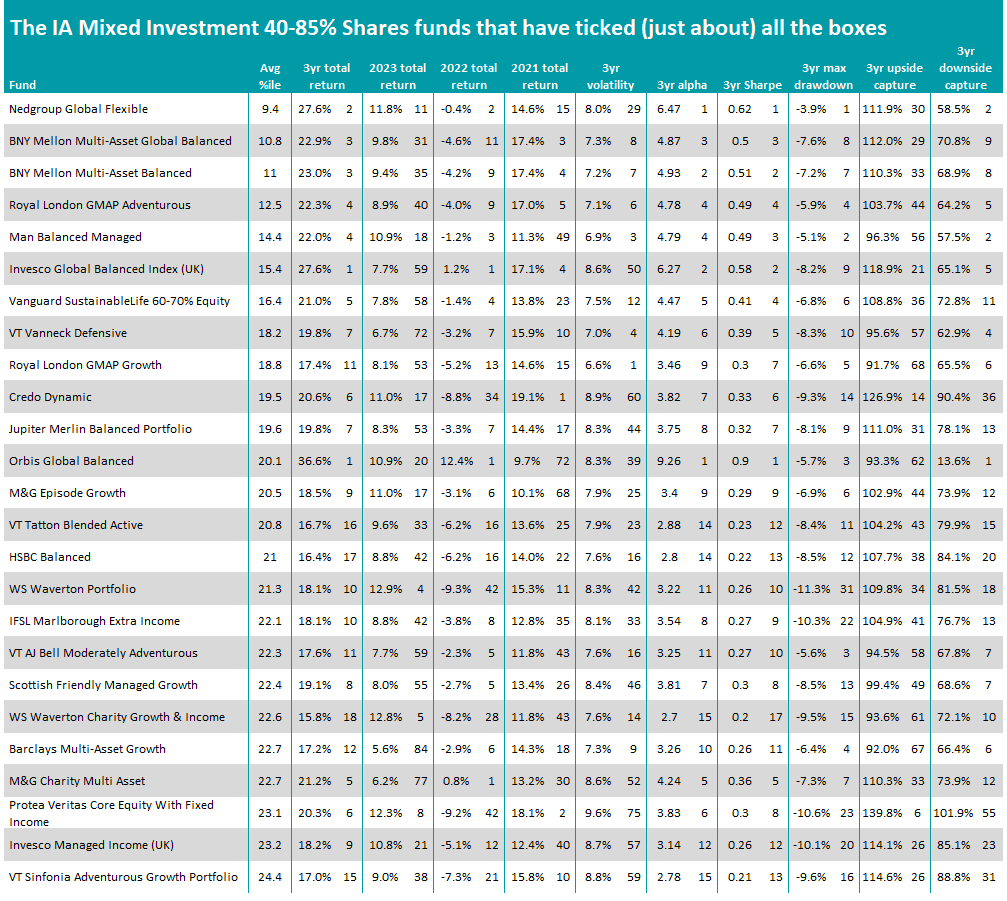
Source: FE Analytics
The £549m BNY Mellon Multi-Asset Global Balanced and £3.1bn BNY Mellon Multi-Asset Balanced funds hold second and third places with respective average percentile scores of 10.8 and 11. Both funds are co-managed by Paul Flood, Simon Nichols and Bhavin Shah.
All three managers are members of the multi-asset team at BNY Mellon-owned Newton Investment Management; Flood is the head of the team. Like all the funds run by Newton, the managers’ approach is both bottom-up and top-down, with Newton’s global thematic framework – which identifies the ‘big picture’ drivers of markets and economies – being a critical element.
Both funds have just under three-quarters of their portfolio in stocks (with one-quarter in US equities), 20% in bonds and about 8% in cash. Top holdings include Microsoft, RELX, Shell, AstraZeneca and Sony.
Other well-known IA Mixed Investment 40-85% Shares funds among the top 25 in this research include Vanguard SustainableLife 60-70% Equity (£795m in assets with an average percentile score of 16.4), Jupiter Merlin Balanced Portfolio (£1.9bn/19.8) and M&G Episode Growth (£829m/20.5).
But you have to look much further down the rankings to get to the biggest funds in the sector.
The £14.3bn Vanguard LifeStrategy 60% Equity fund, the peers group’s largest, is ranked 112th of 198 funds with an average percentile score of 54.9 while the £10.2bn Vanguard LifeStrategy 80% Equity fund is 42nd after scoring 29.8. Baillie Gifford Managed, the third biggest fund with assets of £5.7bn, came in 186th place.
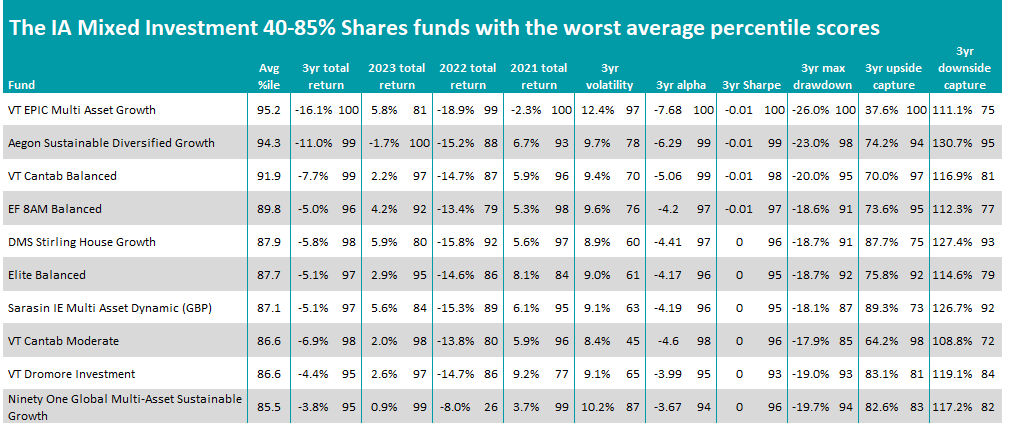
Source: FE Analytics
The worst performing funds in this research can be seen in the table above, all of which are relatively small funds. For example, VT EPIC Multi Asset Growth – which has an average percentile score of 95.2 and the lowest three-year return of the sector – runs just £13.4m.
To see the previous articles in this series, please click here.