


There are 21 active IA Global funds that have made top-quartile returns over the past year without holding any of the MSCI AC World’s largest stocks in their top 10, according to research by Trustnet.
Trustnet recently looked at the global funds leaning hardest on these stocks, which make up a quarter of the index. Leaving them out of a fund’s biggest positions is the opposite bet, as returns then depend on companies outside the group that dominates the benchmark.
In this research, Trustnet used FE fundinfo holdings data to compare the top 10 positions of 342 active IA Global funds with the 10 largest constituents of the MSCI AC World at 30 September 2026. We excluded passive funds, funds of funds and portfolios with holdings data older than July 2026.
Funds qualified if they were top quartile over one year to 30 September 2026 and held none of these stocks in their top 10. It’s worth noting that as the findings cover top 10 holdings only, they may understate each fund’s full exposure.
The MSCI AC World’s top 10 stocks account for 25.4% of the index, led by Nvidia (5.11%), Apple (4.76%) and Microsoft (3.52%). Alphabet’s A and C shares both feature, so the list covers nine companies.
Active IA Global funds hold an average of 14.5% in these companies within their top 10, but 92 of the 342 funds in this research hold none of them among their largest positions.
These funds are spread across the performance tables. Roughly a quarter to a third of funds in each quartile hold none of the leaders in their top 10, but the bottom quartile contains more of them (30) than any other.
Therefore, avoiding the market’s biggest stocks was no guarantee of a strong year. Over the 12 months, funds needed a return of 18.7% to reach the top quartile and the 21 funds that did so without the largest stocks returned between 19.3% and 48.7%. Some have mandates that rule out the leaders, such as smaller-company and sector funds, while others are run by value managers who choose to look elsewhere.
Six of the 21 are also top quartile over three years.
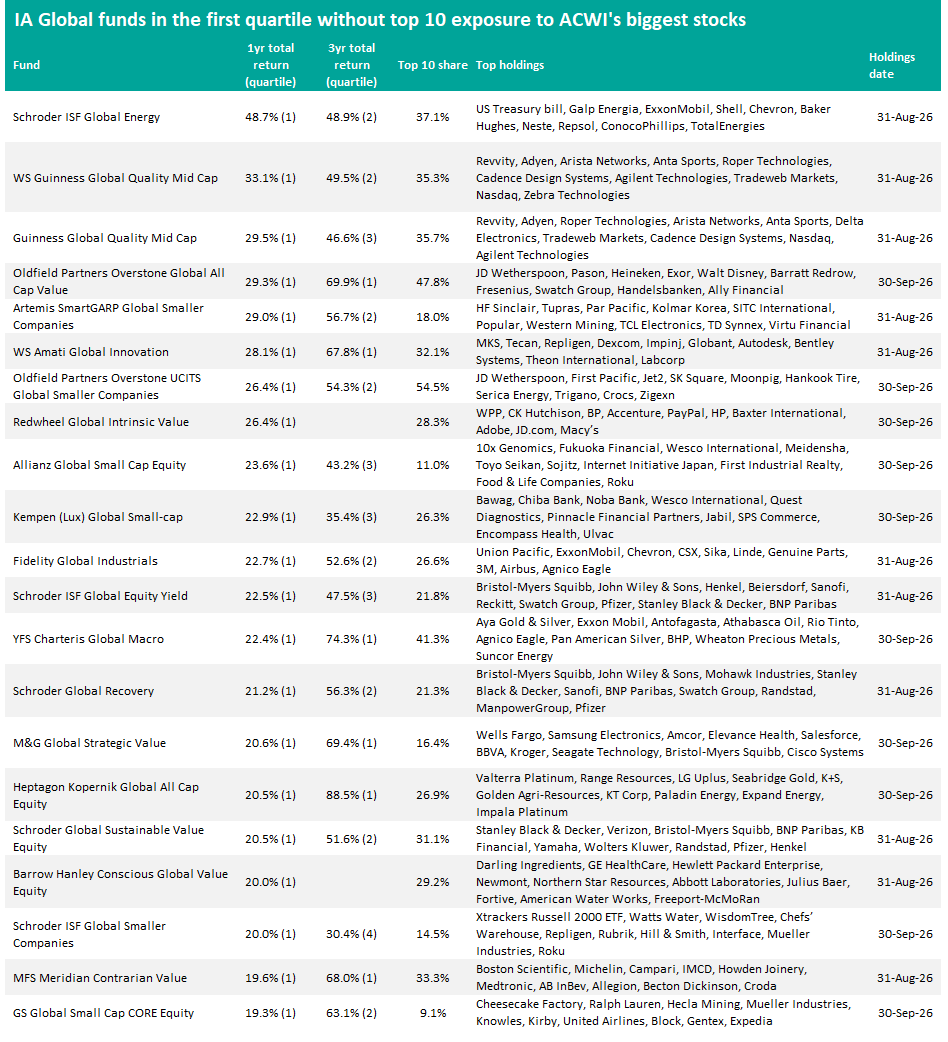
Source: FinXL. Holdings and total return data to 30 September 2026
The largest group, with nine funds, takes a ‘value and contrarian’ approach. These managers buy companies they believe the market has mispriced, often after a period out of favour, so the index’s most highly rated stocks rarely pass their screens.
Oldfield Partners Overstone Global All Cap Value leads this group with a 29.3% return and is also top quartile over three years. It runs a concentrated portfolio, with its top 10 taking up almost half of its assets, and its largest holdings include JD Wetherspoon, Heineken and Walt Disney.
Where value funds own technology, they tend to hold companies that have lost favour with investors. Redwheel Global Intrinsic Value (up 26.4%) owns Adobe, Accenture and PayPal, while M&G Global Strategic Value (up 20.6%) holds Salesforce and Cisco.
Four of the nine value funds are also top quartile over three years: Oldfield, M&G, MFS Meridian Contrarian Value (up 19.6%) and Heptagon Kopernik Global All Cap Equity (20.5%). Kopernik’s 88.5% three-year return is the highest of any fund in the table.
Three Schroder funds – Schroder ISF Global Equity Yield (up 22.5%), Schroder Global Recovery (up 21.2%) and Schroder Global Sustainable Value Equity (up 20.5%) – share many of their top holdings, including Bristol-Myers Squibb, Pfizer and BNP Paribas.
Barrow Hanley Conscious Global Value Equity (up 20%) completes the group.
Six funds focus on smaller companies, led by Artemis SmartGARP Global Smaller Companies (up 29%). Market-cap limits rule out the index leaders by design, as even the smallest of them is many times larger than the companies these funds can buy.
Valuation plays a part here too. Artemis and Oldfield Partners Overstone UCITS Global Smaller Companies (up 26.4%) both apply valuation-led approaches within the smaller-company universe.
The others are Allianz Global Small Cap Equity (up 23.6%), Kempen (Lux) Global Small-cap (up 22.9%), Schroder ISF Global Smaller Companies (up 20%) and GS Global Small Cap CORE Equity (up 19.3%).
For three of these funds, the top 10 accounts for less than 15% of the portfolio, so their largest holdings reveal little about the rest. Their size limits apply to every holding, however.
One step up in size, three funds focus on mid-sized companies. WS Guinness Global Quality Mid Cap (up 33.1%) is the second-best performer in the table, while Guinness Global Quality Mid Cap (up 29.5%) uses the same strategy.
WS Amati Global Innovation (up 28.1%) is not an explicit mid-cap fund, but its portfolio has a mid-cap bias, with technology and healthcare businesses such as MKS, Tecan and Repligen among its largest holdings. It is also top quartile over three years.
The final group comprises three funds with a focus on energy, resources and industrials. Schroder ISF Global Energy tops the table with a 48.7% return, 30 percentage points above the top-quartile cut-off.
The fund holds oil and gas producers such as ExxonMobil, Shell and Chevron. The index leaders are all technology, communication services or consumer companies, so an energy mandate keeps them out.
Schroder ISF Global Energy and Fidelity Global Industrials (up 22.7%) are specialist funds, though both sit in the IA Global sector. The Fidelity fund holds railway operators Union Pacific and CSX in its top 10 alongside energy and materials companies.
YFS Charteris Global Macro (up 22.4%) is not a commodities fund but often has significant exposure to resources stocks. Its largest holdings include gold and silver miners and oil producers, and it is also top quartile over three years.