


US equities are still underperforming many other markets, one year after US president Donald Trump shook up the global order with his ‘Liberation Day’ tariffs, analysis by Trustnet shows.
On 2 April 2025, Trump imposed a 10% baseline and additional reciprocal tariffs on most goods being imported into the US, arguing that it would encourage manufacturers to build new factories in the US and create jobs.
Stock markets sold off sharply on the news but soon rallied when Trump moved away from imposing the maximum level of reciprocal tariffs he had threatened. However, the past 12 months had plenty of other Trump-based risks for investors to navigate.
Performance of asset classes since Liberation Day
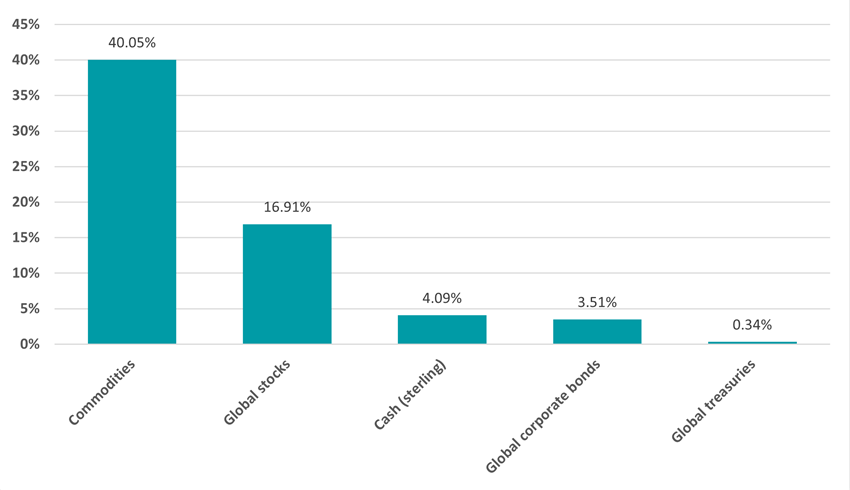
Source: Finxl. Total return in sterling between 2 Apr 2025 and 1 Apr 2026
Russ Mould, investment director at AJ Bell, said: “Bonds have done badly and although equities have recovered, commodities have outpaced them. This perhaps reflects how Covid-19, tariffs and wars in the Middle East and Eastern Europe place fresh emphasis upon supply chains and reliable sources of vital materials as a key part of national and economic security.”
The outperformance of commodities, however, is a relatively recent occurrence. FE fundinfo data shows that global stocks (represented by the MSCI AC World index) were ahead of commodities (S&P GSCI) for most of the past year. But commodity prices surged when Iran effectively closed the Strait of Hormuz in response to the US and Israel’s ongoing attacks.
Given the importance of the Strait of Hormuz in the oil supply chain, energy commodities have risen the most over the past year with gas oil up 133%, heating oil up 124% and Brent crude up 63%. Precious metals also gained: silver rose 111.6%, gold 44.5%.
Performance of equity regions since Liberation Day
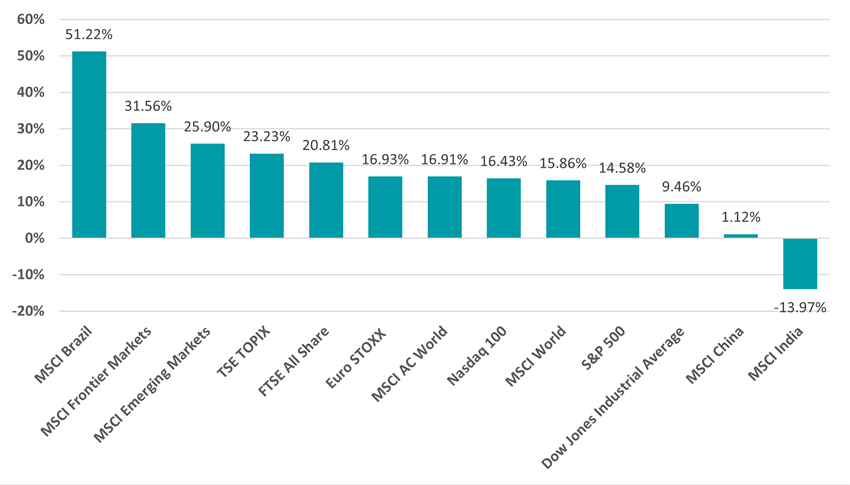
Source: Finxl. Total return in sterling between 2 Apr 2025 and 1 Apr 2026
Within international stock markets, emerging markets have made the highest returns since Liberation Day, despite the expectation that they would suffer the most under Trump’s tariffs. The MSCI Emerging Markets index has outpaced the developed markets-focused MSCI World index by some 10 percentage points.
However, it’s worth noting that emerging markets have fallen harder than developed markets over the past few weeks after investors responded to the Iran crisis by locking in profits from recent winners.
The US has tended to lag behind other markets over the past year, as the ‘US exceptionalism’ narrative started to crack under the Trump administration’s erratic and disruptive policies. Japan, the UK and Europe join emerging markets in beating the US over the past 12 months.
Mould said: “Tariffs and strong-arm trade tactics, challenges to the independence of the US Federal Reserve and now military incursions in Latin America and the Middle East, as well as sabre-rattling over Greenland, are combining with lofty American stock market valuations and a soaring Federal deficit and prompting investors to reassess the narrative of American exceptionalism.”
Energy stocks lead the equity sectors, with the MSCI AC World Energy index rising 35.7% on surging oil and gas prices. The materials and information technology indices are up around 30%. Consumer discretionary has been the worst sector, rising just 2.5% as tariffs and inflation caused consumers to tighten their budgets.
Among investment factors, small-caps have made the highest returns: the MSCI ACWI Small Cap index gained 22.8%, compared with 17.2% from its large-cap counterpart. Smaller companies tend to be more domestically focused, suggesting investors see them as being less affected by the US’ tariffs.
Meanwhile, growth and momentum investing were up 17.7% and 17.5% respectively, edging ahead of the quality (15.8%) and value (15.2%) styles.
Performance of fund sectors since Liberation Day
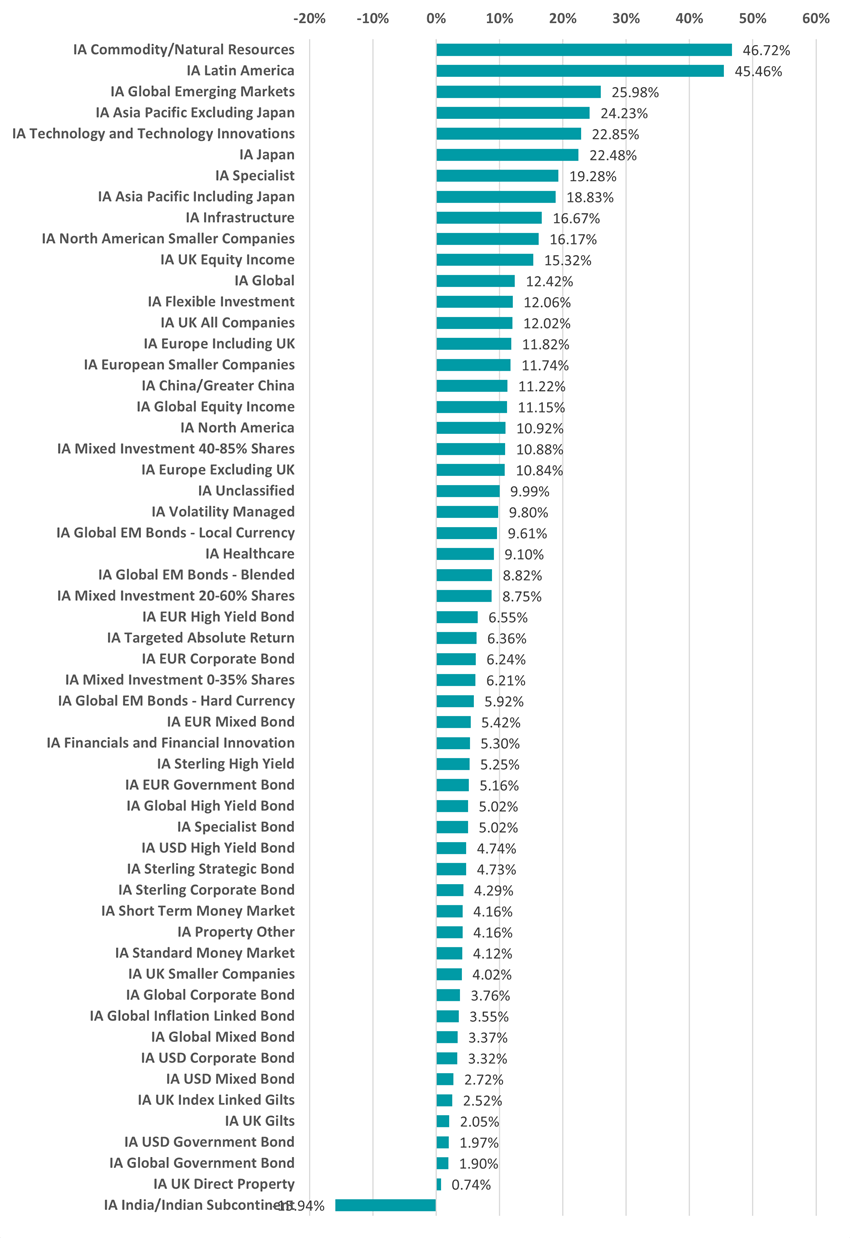
Source: Finxl. Average return in sterling between 2 Apr 2025 and 1 Apr 2026
Given this backdrop, the performance of fund sectors in the Investment Association universe should not be too surprising, with IA Commodity/Natural Resources topping the leaderboard thanks to an average return of 46.5%.
WS Amati Strategic Metals is the strongest individual fund here with a total return of 125.8%, followed by UBS Solactive US Listed Gold & Silver Miners UCITS ETF (118.4%), WisdomTree Strategic Metals and Rare Earths Miners UCITS ETF (109.7%), Orion Resource Equities (106.2%) and YFS Charteris Gold and Precious Metals (99%).
IA Latin America is close behind with a 45.5% average return, reflecting the strong performance of Peru (up 91.2%), Colombia (82.9%), Brazil (51.2%) and Mexico (49%). The countries’ stock markets are beneficiaries of a weaker dollar, rising commodity prices and market-oriented reforms.
The peer group’s highest 12-month returns came from iShares MSCI EM Latin America UCITS ETF (51.8%), Templeton Latin America (51.1%) and Barings Latin America (47.7%).
The only sector to lose money since Liberation Day is IA India/Indian Subcontinent, where the average fund is down 15.9%. Indian equities had outperformed for several years, but valuation concerns, US trade uncertainty, a lack of AI exposure and the Iran war prompted investors to sell out.
| The best performing funds since Liberation Day | ||||
| Fund | Sector | Total return | ||
| WisdomTree Uranium And Nuclear Energy UCITS ETF | IA Global | 145.49% | ||
| WS Ruffer Gold | IA Specialist | 126.24% | ||
| WS Amati Strategic Metals | IA Commodity/Natural Resources | 125.81% | ||
| SVS Baker Steel Gold & Precious Metals | IA Specialist | 120.69% | ||
| UBS Solactive US Listed Gold & Silver Miners UCITS ETF | IA Commodity/Natural Resources | 118.37% | ||
| HSBC MSCI Korea Capped UCITS ETF | IA Specialist | 112.63% | ||
| Amundi NYSE Arca Gold Bugs UCITS ETF | IA Specialist | 112.04% | ||
| Xtrackers MSCI Korea UCITS ETF | IA Specialist | 111.59% | ||
| iShares MSCI Korea UCITS ETF Inc | IA Specialist | 111.19% | ||
| WisdomTree Strategic Metals and Rare Earths Miners UCITS ETF | IA Commodity/Natural Resources | 109.67% | ||
| Franklin FTSE Korea UCITS ETF | IA Specialist | 109.01% | ||
| Orion Resource Equities | IA Commodity/Natural Resources | 106.23% | ||
| Jupiter Gold And Silver | IA Specialist | 102.25% | ||
| Barings Korea Trust | IA Specialist | 102.16% | ||
| YFS Charteris Gold and Precious Metals | IA Commodity/Natural Resources | 98.96% | ||
| UBS Solactive Global Pure Gold Miners UCITS ETF | IA Commodity/Natural Resources | 98.92% | ||
| Ninety One Global Gold | IA Specialist | 97.41% | ||
| BlackRock Gold & General | IA Specialist | 95.28% | ||
| iShares Gold Producers UCITS ETF | IA Global | 95.15% | ||
| JPM Korea Equity Fund | IA Specialist | 92.88% | ||
| L&G Battery Value-Chain UCITS ETF | IA Global | 92.86% | ||
| Quilter Investors Precious Metals Equity | IA Specialist | 90.04% | ||
| WisdomTree Renewable Energy UCITS ETF | IA Global | 87.15% | ||
| Polar Capital Global Technology | IA Technology & Technology Innovation | 85.58% | ||
| Amundi STOXX Europe 600 Energy Screened | IA Specialist | 84.41% | ||
Source: Finxl. Total return in sterling between 2 Apr 2025 and 1 Apr 2026
With a total return of 145.5%, WisdomTree Uranium And Nuclear Energy UCITS ETF is the individual fund with the highest gain in the entire Investment Association universe.
Explaining the strong performance of uranium investments, WisdomTree research director Mobeen Tahir said: “Uranium is the essential fuel underpinning nuclear energy, a sector seeing renewed and accelerating demand from both governments and the private sector. With global nuclear capacity set to expand meaningfully over the coming decades, uranium demand is rising at a time when supply is already constrained and expected to tighten further.”
Many of the funds in the list of the best performers since Liberation Day are gold funds. The yellow metal surged in 2025 but has struggled more recently, leading some to question its safe haven status during the Iran war.
Gold peaked at $5,589.38 per ounce on 28 January but had fallen to $4,763.38 at the time of writing, despite the elevated geopolitical risk, energy shock, rising volatility and global growth worries that usually bolster the metal.
However, Sprott market strategist Paul Wong said: “We believe the move reflects a broad liquidity-driven selling event, driven by macro reserve-flow dynamics and forced deleveraging across investment portfolios. In short, gold is being sold because liquidity is being raised, not because its role as a strategic asset has diminished.”