


Listing SpaceX, OpenAI and Anthropic alongside the existing big AI stocks would take the group’s market-cap concentration to close to half of the S&P 500, Bank of America analysis suggests.
The bank’s Flow Show report, published 22 May 2026, calculates that if SpaceX, OpenAI and Anthropic were to list and join what it terms the ‘AI Big 10’, the resulting group would account for approximately 47-48% of S&P 500 market capitalisation.
That figure would surpass the concentration seen during the Roaring Twenties, the Nifty Fifty era of the 1970s, Japan’s equity boom in the 1980s and the TMT bubble of the late 1990s. The only greater concentration on record is US railroad stocks in the 1880s.
BofA defines the AI Big 10 as the Magnificent Seven (Apple, Microsoft, Nvidia, Amazon, Alphabet, Meta and Tesla) plus Broadcom, AMD and Micron. This group already represents a substantial share of S&P 500 market capitalisation before any new listings.
Public offerings of SpaceX, OpenAI and Anthropic – which are preparing to list in the near future – would close the remaining gap with 1880s railroad-era concentration levels, which reached 63%.
The bubble history of stock market concentration measured as % of US market cap
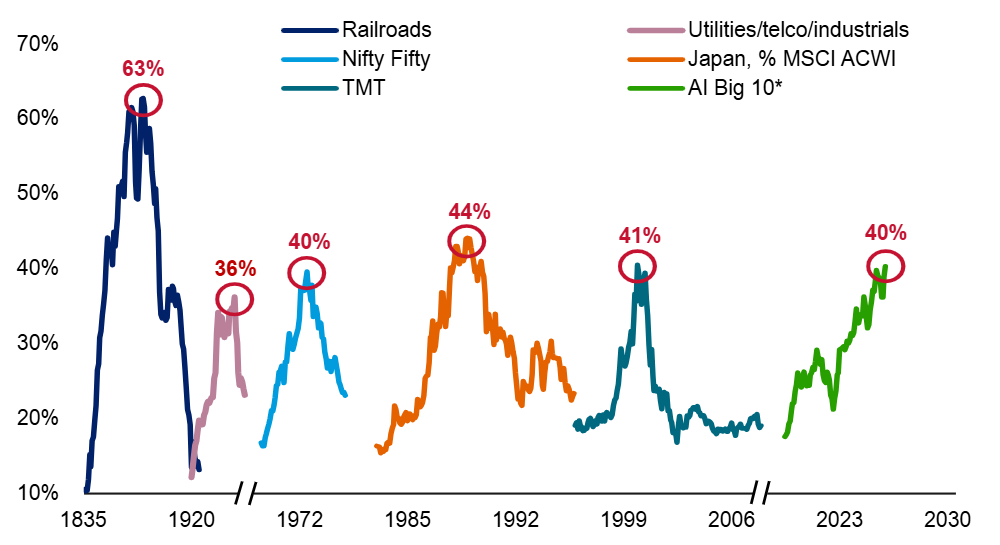
Source: BofA Global Investment Strategy, GFD Finaeon, Bloomberg. Note: Japan is measured as % of MSCI ACWI, all others as % of US stock market
In the Roaring Twenties, a narrow group of industrial and utility companies dominated US market capitalisation before the 1929 crash, while the Nifty Fifty era concentrated institutional capital into roughly 50 large-cap growth stocks before the bear market of 1973-74.
The TMT bubble of the late 1990s, the most recent direct precedent given its focus on tech stocks, ended with the S&P 500 falling approximately 49% between March 2000 and October 2002.
The BofA analysis suggests that SpaceX, OpenAI and Anthropic being added to the AI Big 10 would push concentration materially past these levels.
Only US railroad stocks in the 1880s were more dominant. Railroads were perceived by investors at the time as structurally dominant in perpetuity, the essential infrastructure layer of the economy attracting enormous speculative capital.
But that era ended with the railroad bust of the 1890s, a prolonged period of overcapacity, bond defaults and equity market stress that reshaped the US financial system.
BofA also outlined how a bubble of the current scale eventually unwinds, saying a surge in bond yields is the historical mechanism by which booms end and pointing to “bond vigilantes on manoeuvres” as the near-term risk.
It gave CPI reaching 4-5% in the coming months as the likely inflection point, after which “big top policy tightening” is expected to follow. Across 11 instances since 1934, when CPI first crossed 4%, the S&P 500 averaged a loss of 3.5% over the following three months and 6.6% over six months.
Some of the bank’s other indicators also strike a cautious tone, with its Bull & Bear Indicator reaching 8.0 after heavy inflows into technology and emerging debt, a record monthly jump in funds’ equity allocations and funds’ cash levels falling to 3.9%.
Five of the Bull & Bear Indicator’s six components are now reading Bullish or Very Bullish, which the bank interprets as a sell signal. Since 2002, BofA has recorded 17 sell signals from this indicator and global equities have averaged a loss of 2-3% over the subsequent two to three months, with a hit ratio of approximately 60% and maximum drawdowns reaching 15-20% in the more severe episodes.
Despite the signal, BofA said: “No one is cutting longs in stocks before historic IPOs.”