


There won’t be many investors looking back in 2022 with any fondness, after rising inflation and interest rates, the war between Russia and Ukraine, and worries about the global economy caused some brutal market falls. 
The effects of this were wide-reaching with few areas of the market left untouched by last year’s volatility, especially those that had previously been some of the strongest performers.
Below, Trustnet reviews 2022 from a range of viewpoints to show investors exactly what did and didn’t work.
Asset class
Last year proved to be a brutal one for both equity and fixed income markets as high inflation and interest rate hikes spooked investors, as the chart below shows. Because of the fall in the pound that occurred over 2022 we’ve included both sterling returns (the blue line) and local currency returns (the grey line), to show the difference between the performance for UK-based investors and how it really looked ‘on the ground’.
Global stocks dropped 8.1% in sterling terms but this is massaged by the weak pound – in local currency terms, the MSCI AC World index was down 16%. Likewise, global government bonds shed 7.1% in sterling while corporate bonds were down 6.2% although the losses for each are 10 percentage points higher in local currencies.
Performance by asset class in 2022
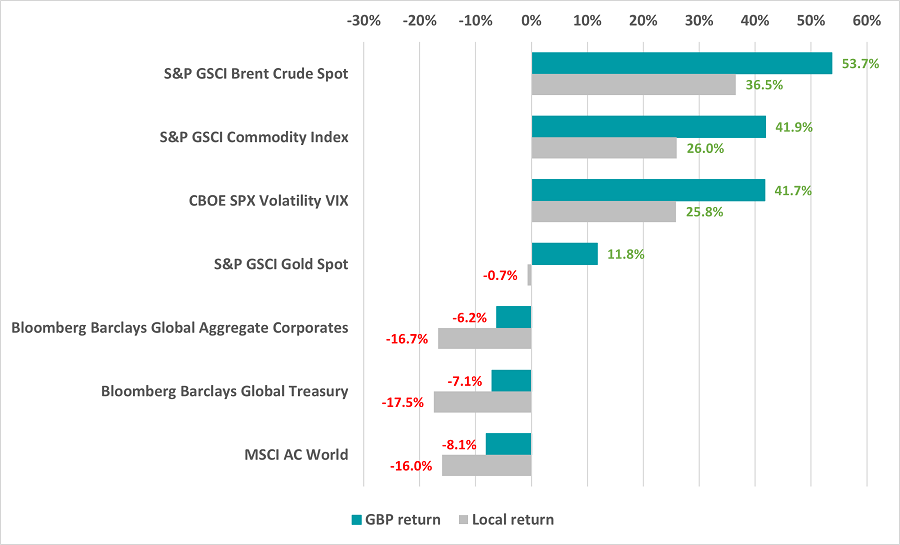
Source: FinXL. Total return between 1 Jan and 31 Dec 2022.
However, the inflationary backdrop meant that strong returns were witnessed in commodities. The broad S&P GSCI Commodity index was up 41.9% in sterling terms as supply bottlenecks and the war in Ukraine pushed prices up, with energy commodities among the biggest gainers.
Geography
When looking at the major international stock indices, the UK held up relatively well with the FTSE All Share posting a small total return for the year. This compares favorably with the falls for the S&P 500 and emerging market stocks.
Performance by geography in 2022
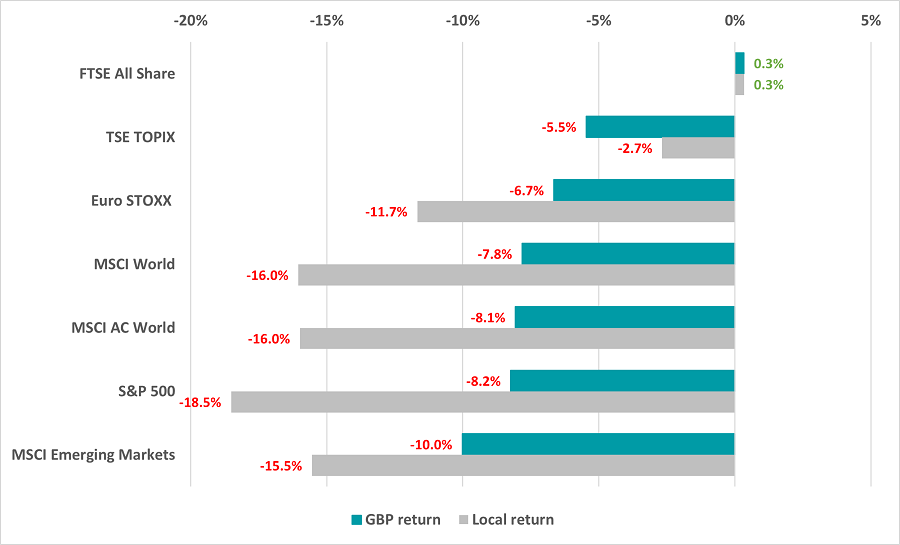
Source: FinXL. Total return between 1 Jan and 31 Dec 2022
Drilling down into individual countries finds plenty more areas where positive returns were posted. The MSCI Turkey index rose 170% in local currency as eye-wateringly high inflation meant investors poured money into domestic stocks, while the high oil price has benefited exporters such as Bahrain, Brazil and Kuwait.
Investment style, industry and market cap
The following chart shows how there was a rotation away from the growth style – which had led the market for much of the post-financial crisis period – and towards value stocks in 2022.
The explanation for the shift away from growth stocks, like many of the explanations for last year’s market moves – is interest rates. The growth style tends to be the biggest loser when rates are rising, as it makes investors less willing to accept their slim near-term profits and pay up for their future earnings potential.
Performance by investment style in 2022
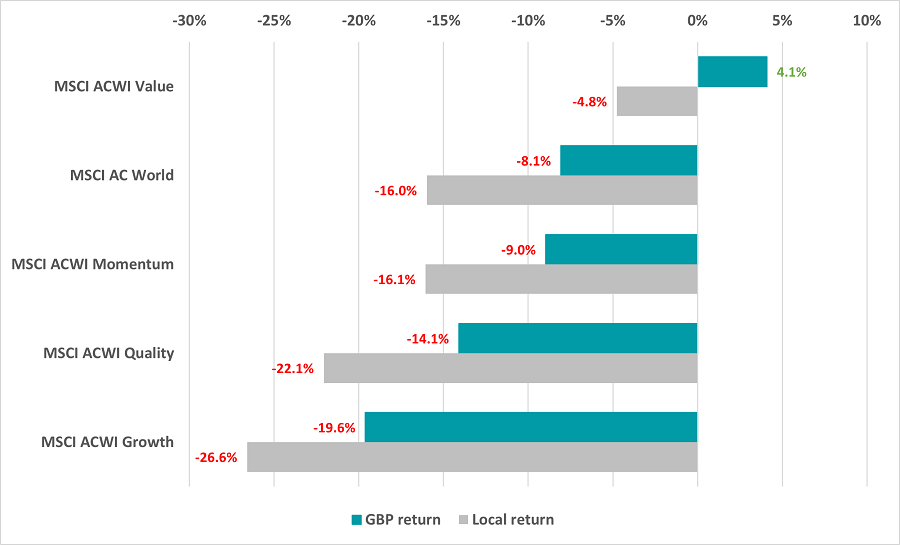
Source: FinXL. Total return between 1 Jan and 31 Dec 2022
This is also reflected when we look at the various industries in the global stock market. The worst performers are those with sensitivity to higher interest rates: consumer discretionary, which relies on people having the ability and willingness to buy luxury goods, and information technology, which is home to many growth companies, including some that were trading on lofty valuations.
Performance by global industry in 2022
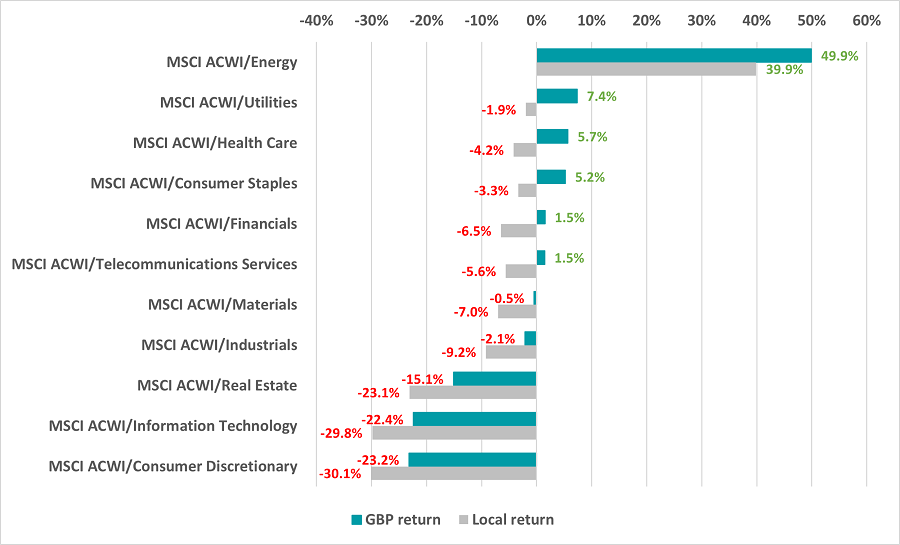
Source: FinXL. Total return between 1 Jan and 31 Dec 2022
Energy companies made the highest return, on account of surging oil and gas prices caused by the war in Ukraine and sanctions on Russia. While six industry indices were positive for sterling-based investors, energy was the only one place where positive returns were made in local currencies.
Performance by market cap in 2022
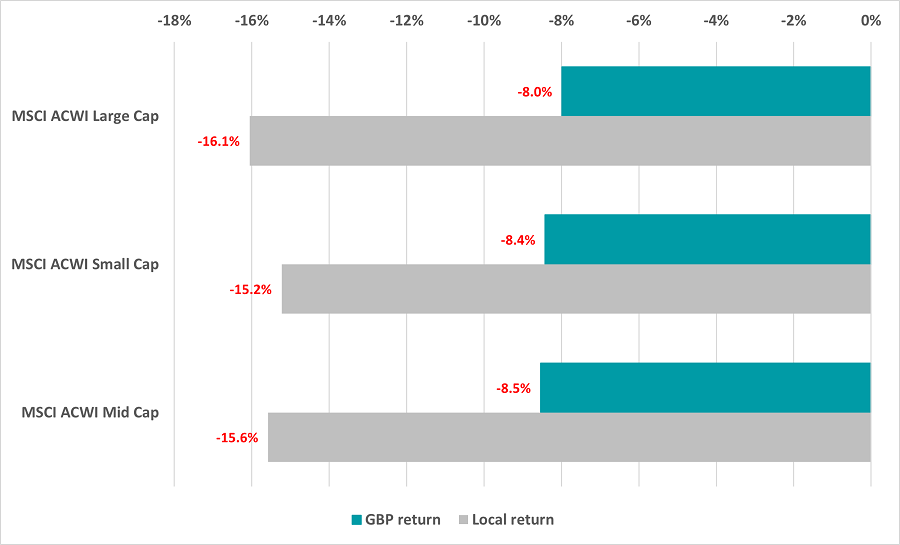
Source: FinXL. Total return between 1 Jan and 31 Dec 2022
As the chart above shows, there was no clear winner by company size last year, with the global large-, mid- and small-cap indices all posting losses for both sterling and local currency investors.
When market cap and investment style are taken together, large value stocks led the market with a 5.6% sterling return and a 3.5% fall in local currency terms while the small- and mid-value indices beat their growth counterparts by a decent margin. Large growth companies were hit hardest, falling 20.2% in sterling and 27.3% in local currency.
Commodities
Commodities were one of the few parts of the market to experience positive returns in 2022. As is clear from the chart below, energy commodities jumped the most although food prices have also increased significantly over the past year.
Performance of select commodities in 2022
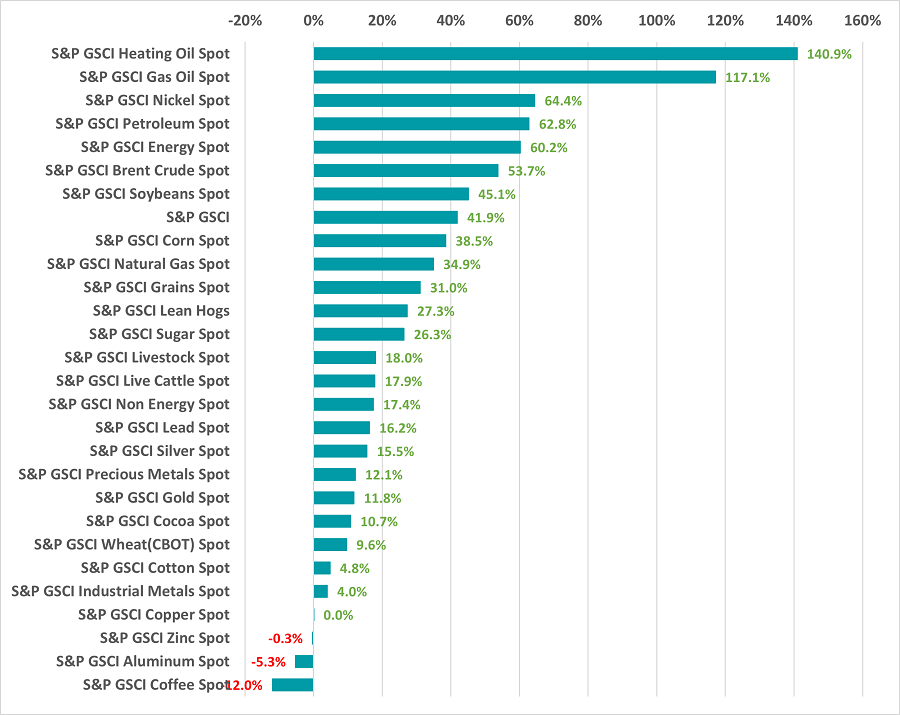
Source: FinXL. Total return between 1 Jan and 31 Dec 2022
Fund sectors
Ending with the performance of the Investment Association fund sectors, FE fundinfo data shows that the highest returns came from the IA Commodity/Natural Resources and IA Latin America sectors.
This is down to rising commodity prices: the first sector invests in companies directly involved in this industry while many Latin American nations are net exporters of key commodities.
Performance of equity funds in 2022
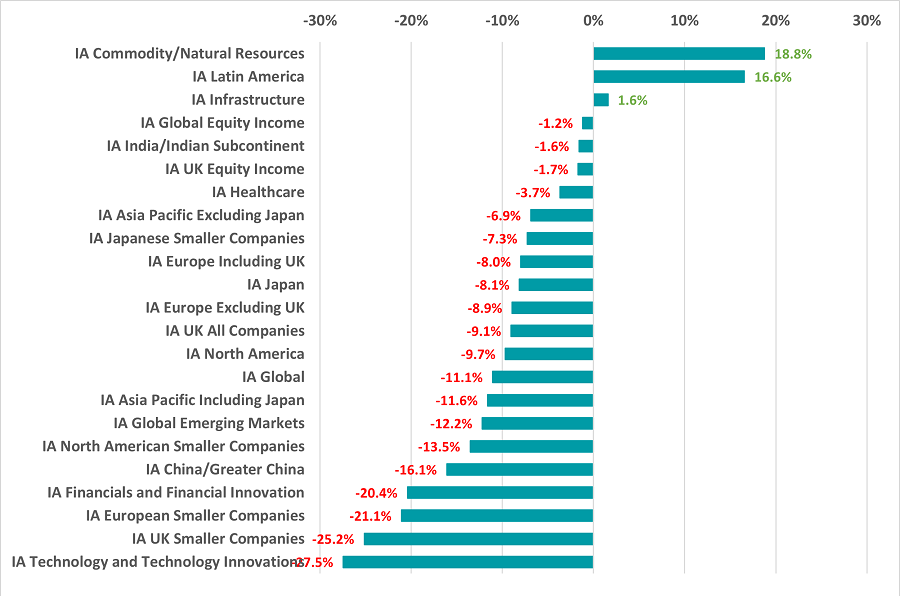
Source: FinXL. Total return between 1 Jan and 31 Dec 2022
As would be expected, sectors where the focus is on growth stocks – such as IA Technology and Technology Innovations and IA UK Smaller Companies – suffered the heaviest losses of the equity peer groups.
Performance of bond funds in 2022
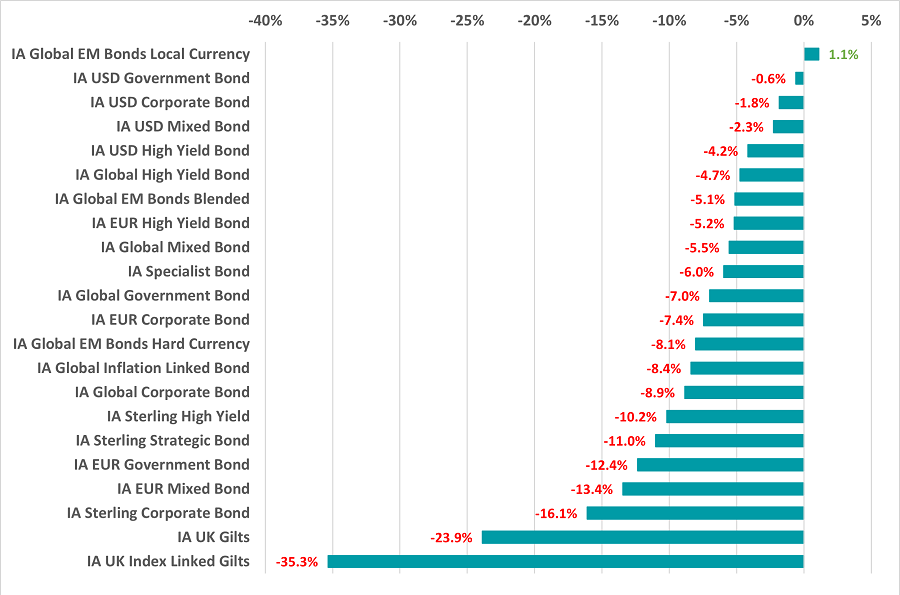
Source: FinXL. Total return between 1 Jan and 31 Dec 2022
Rising interest rates meant that fixed income funds had a bruising year, with the average IA UK Index Linked Gilts fund losing more than 35% while IA UK Gilts was down 23.9%. IA Global EM Bonds Local Currency is the only bond sector with a positive return last year.
Performance of multi asset funds in 2022
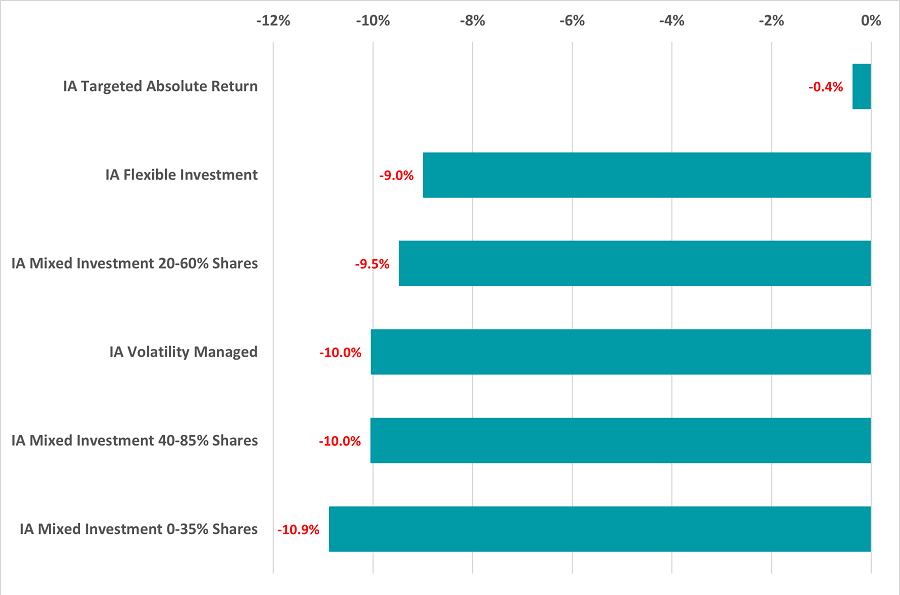
Source: FinXL. Total return between 1 Jan and 31 Dec 2022
All of the Investment Association’s mixed asset sectors are showing a loss for 2022. The IA Targeted Absolute Return sector came out best, keeping its average loss to 0.4%; on the other hand, IA Mixed Investment 0-35% Shares (which has a high weighting to bonds) shed almost 11%.