


UK equities, energy stocks, financials and small-caps have all been the biggest beneficiaries of the market rotation away from growth into value that has played out in the last six months or so.
Value stocks - those which appear 'cheap' relative to fundamentals such as future earnings - have been outperforming the overall market in the last several months.
In the same period, growth stocks – those which investors pay a premium for expecting higher than expected earnings growth – have been underperforming the overall market.
Although the performance gap between growth and value had been going on for at least a decade, the divergence in performance accelerated dramatically in the last few years.
Performance of MSCI AC World Value vs Growth over 5yrs
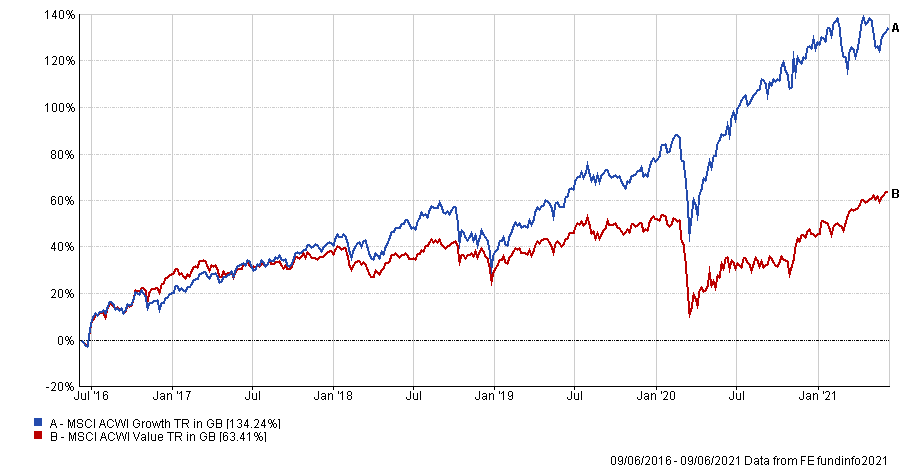
Source: FE Analytics
However, when the Pfizer-BioNTech vaccine was shown to have more than a 90 per cent efficacy against Covid-19, it led to a long-awaited rotation out of growth in favour of value.
This rotation can be clearly seen in the performance of growth versus value since 9 November 2020 when the efficacy results were announced - dubbed ‘Vaccine Monday’.
Performance of MSCI AC World Value vs Growth since ‘Vaccine Monday’
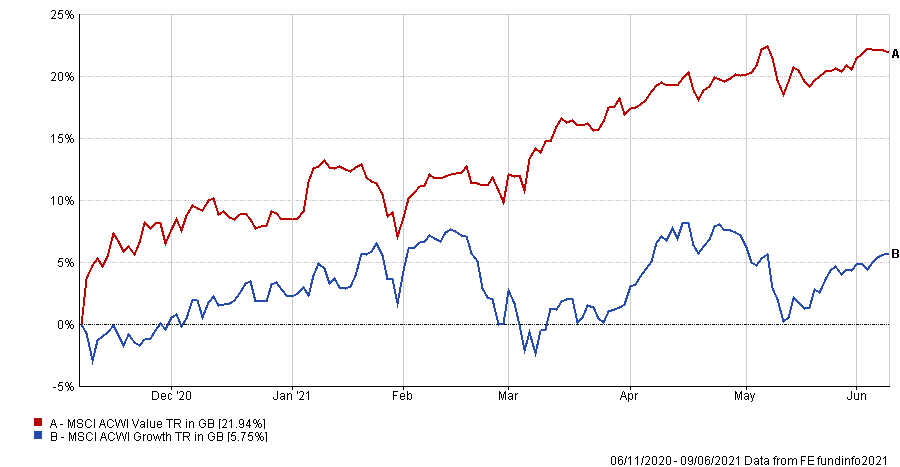
Source: FE Analytics
However despite the overall outperformance by the value investment style, the outperformance has not been as clear-cut in each month.
This can be seen in the chart below which shows the discrete total return of value versus growth month by month.
Monthly performance of MSCI AC World Value vs Growth since ‘Vaccine Monday’
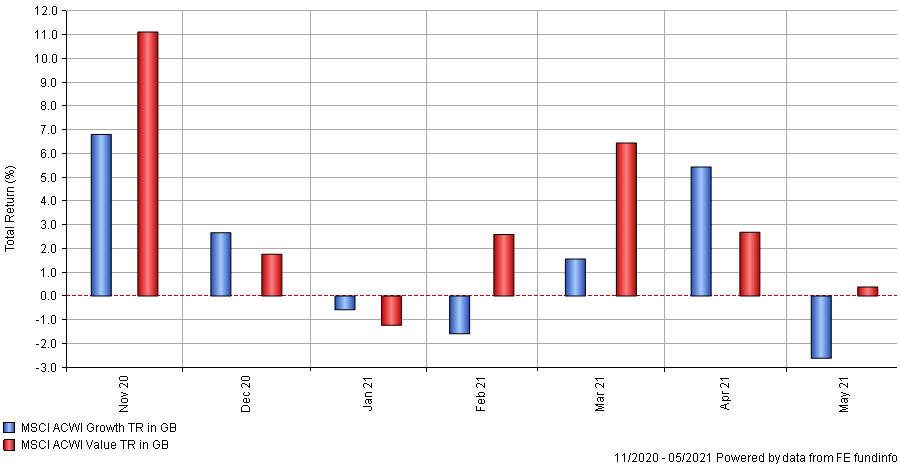
Source: FE Analytics
The outperformance of value versus growth can be further seen in the relative performance of value and growth against the entire MSCI AC World index below.
Relative performance of MSCI AC World Value vs Growth since 'Vaccine Monday'
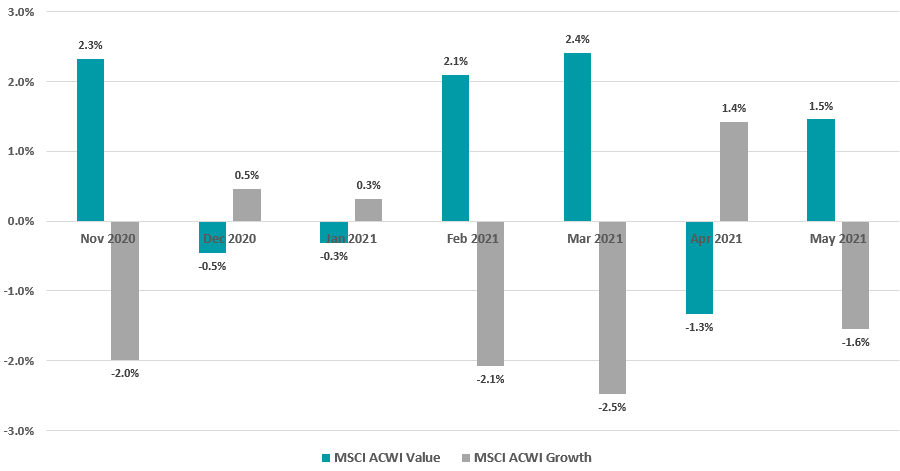
Source: FinXL
The months of November, February and March saw value outperform by the largest margins. These were also the months in which growth stocks heavily corrected amidst fears of growing inflation that rattled the Treasury markets.
However not all regions have benefited from the value rally as equally. The chart below shows the equity market performance of each region since Vaccine Monday.
Performance of major regions between 9 Nov 2020 and 9 Jun 2021
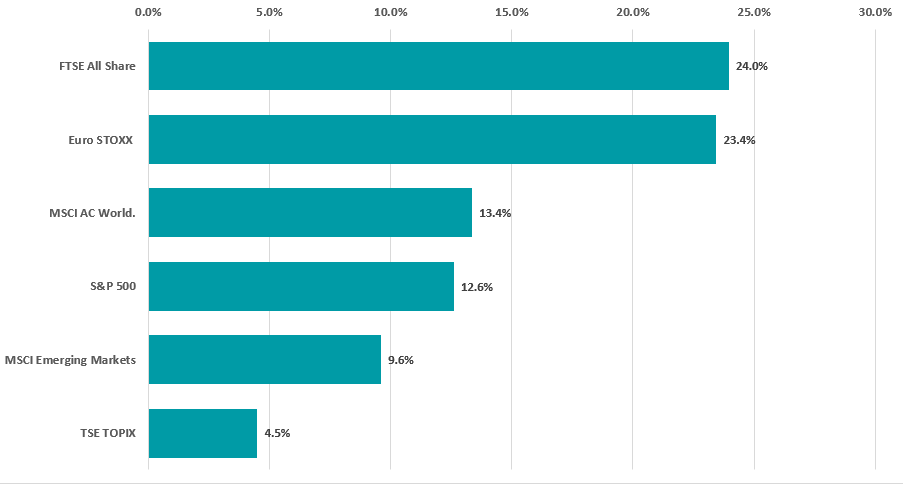
Source: FinXL
For example, regions such as the UK tend to have more value-heavy industries dominating their equity index weightings and have performed better during the rotation.
Similarly, a growth-heavy market index such as the S&P 500, where the US technology giants account for almost a quarter of the index weighting, hasn’t performed as well.
Breaking down the rotation by market capitalisation, it seems that not all asset classes have benefited from the value rally equally.
The below chart shows the performance of global equities broken down by their market capitalisation and investment style.
Performance of global equities by market cap and investment style between 9 Nov 2020 and 9 Jun 2021
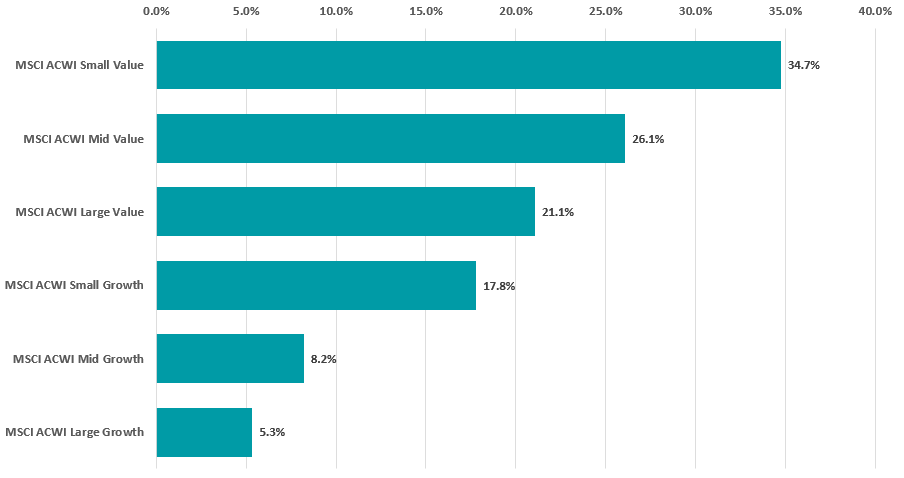
Source: FinXL
Global small-cap value outperformed by a wide margin, in trend with the value investment style outperforming across all market capitalisations.
The fact that large-cap value stocks outperformed even small-cap growth stocks suggests that the value bias outweighed the impact of the smaller companies effect, which predicts that small-cap companies tend to outperform their larger counterparts.
In the UK, it was a similar situation with small-cap value outperforming. But surprisingly, large-cap value outperformed mid-cap value.
Performance of UK equities by market cap and style between 9 Nov 2020 and 9 Jun 2021
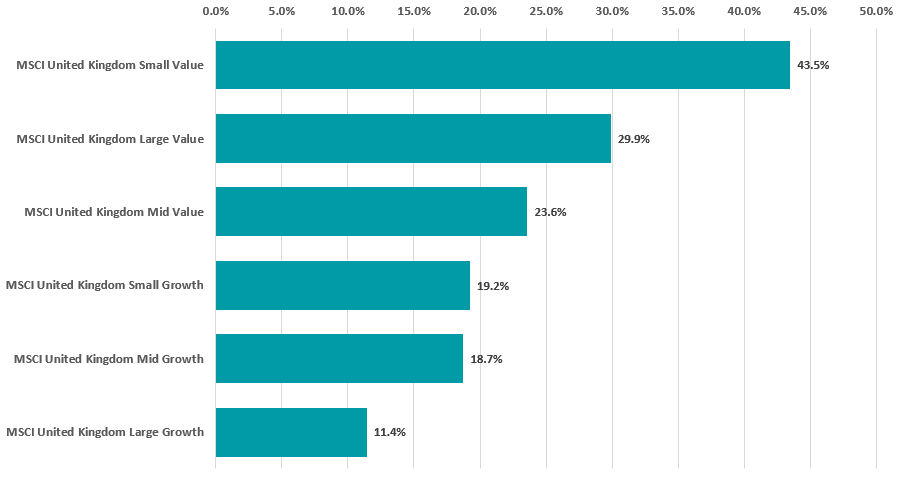
Source: FinXL
In the UK equity market, the large-cap companies are largely dominated by giant energy and financial services companies, both of which have benefited from rising oil prices and inflation fears stoking the potential for rising interest rates.
Different industries have also experienced a divergence in performance during the last several months since Vaccine Monday, which can be seen below.
Performance of global industries between 9 Nov 2020 and 9 Jun 2021
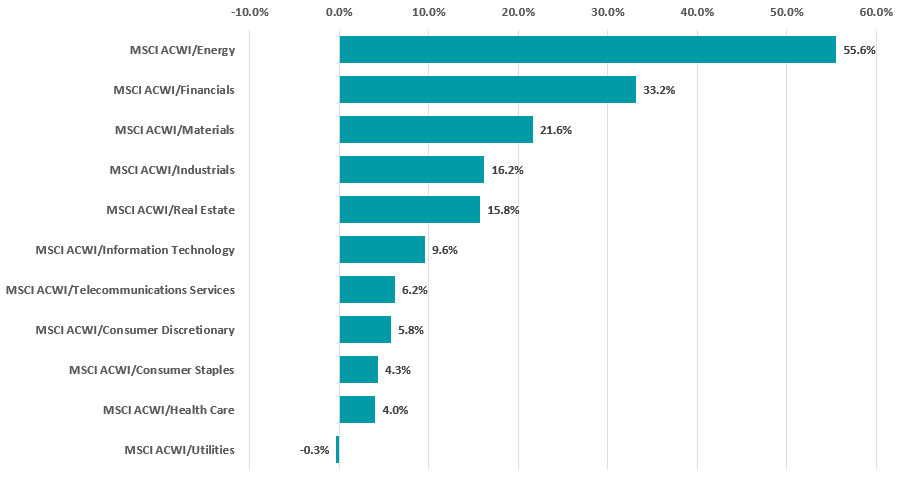
Source: FinXL
Energy and financials far outperformed any other industry. Other value-heavy industries such as materials, industrials and real estate also outperformed.
One exception to this seems to be the utilities industry, which has underperformed even the growth-heavy industries such as information technology, consumer discretionary and health care.
Much of the performance of the energy industry and materials industry may be attributable to the dramatic rise in the prices of commodities which began to accelerate after Vaccine Monday.
The chart below shows the performance of various commodities since then.
Performance of commodities between 9 Nov 2020 and 9 Jun 2021
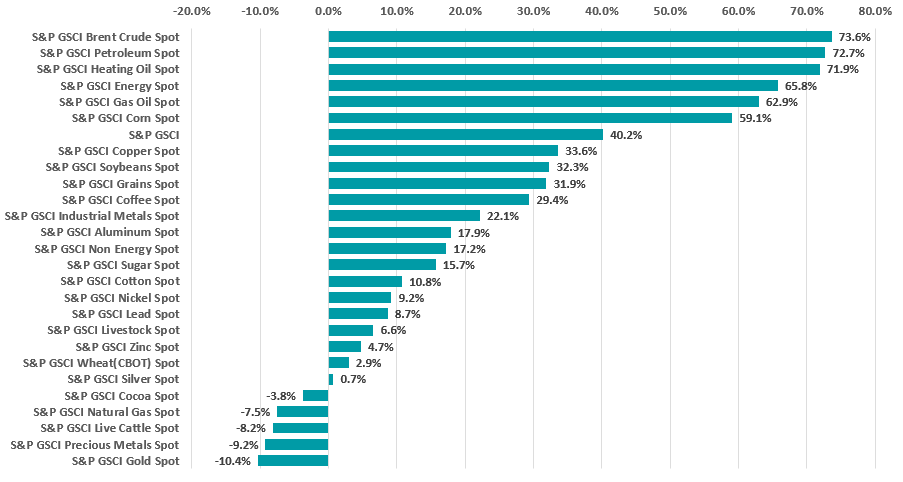
Souce: FinXL
The rise in commodities could be a result of the global quantitative easing causing inflationary pressures. The rising prices nevertheless boost the profit margins of energy companies and miners.
In terms of how the value rotation has affected the various Investment Association sectors, the UK equity market seems to be the biggest beneficiary.
Performance of Investment Association equity sectors
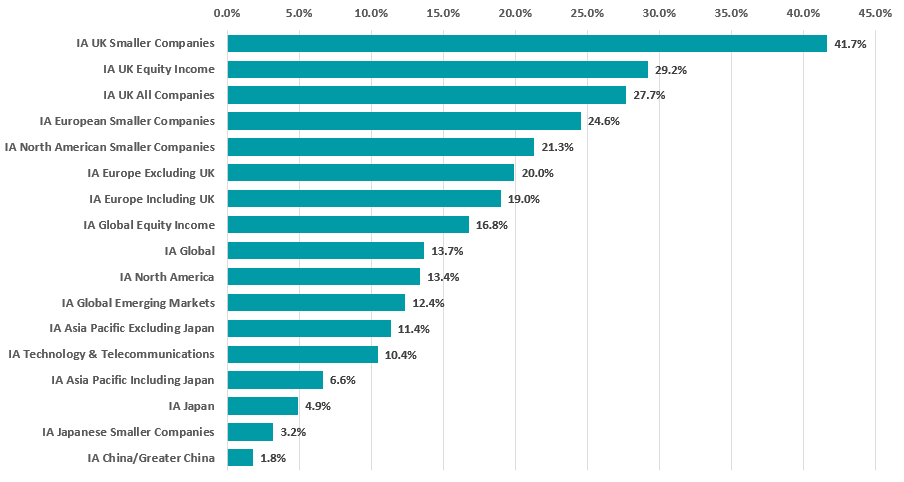
Source: FinXL
IA UK Smaller companies outperformed by a wide margin, followed by UK equity income – which has many energy and mining stocks paying high dividends. It also has many high-yielding stocks which typically fall under the value bucket.