


Threadneedle UK Equity Income is the most consistent IA UK Equity Income fund of the past decade, beating the FTSE All Share – the most common benchmark in the sector – in eight of the past 10 calendar years, while also besting its peers over the same number of periods, Trustnet has found.
Two other funds – LF Montanaro UK Income and BMO Responsible UK Income – also beat the FTSE All Share in eight of the past 10 years. However, they weren’t quite as consistent when it came to outperforming their sector average: LF Montanaro UK Income managed the feat in seven of the past 10 years, while BMO Responsible UK Income managed it in six.
Performance of funds vs sector and index
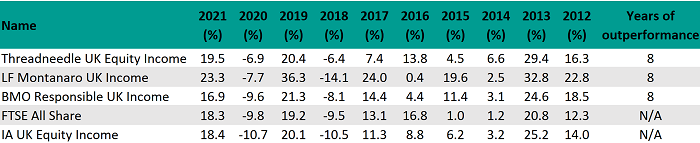
Source: FE Analytics
Of the 69 funds with a track record long enough to be included in the study, another eight funds beat the FTSE All Share in seven of the past 10 calendar years.
Threadneedle UK Equity Income is headed up by Richard Colwell, whose process is based on the belief that valuations are too susceptible to short-term news flow, creating opportunities for investors who take a long-term approach.
His process aims to answer three questions about a business: can it continue to grow? Can it successfully convert earnings streams into cash flows? And finally, does the firm have good management in place who can allocate capital efficiently?
Bestinvest described Threadneedle UK Equity Income as an “excellent fund for income investors”, with the manager’s portfolio construction making it suitable for all market conditions.
“Colwell has been generally cautious more recently and has built his portfolio around an ‘engine room’ of solid businesses offering resilient dividends,” it said.
“He supplements this with selected recovery names – poorly performing businesses such as Morrisons and BT that might be riskier but offer greater potential returns.”
In a recent note to investors, Colwell likened the global market to what economist John Kenneth Galbraith termed the “bezzle” in the 1920s: “An as-yet-unrevealed inventory of nasty shocks built up in the good times, which only reveal themselves when tougher times arrive. When tougher times arrive, this crowded capital could be exposed to bezzle assets that quickly plummet.”
In contrast, he said the UK was quietly going about its business: “The volatility of the post-Brexit deal seems to have settled, JP Morgan recently turned bullish on UK equities for the first time since the referendum, and in the summer Bloomberg was hailing ‘the City’s IPO renaissance’ as new listings during the first six months of 2021 rose by 467% with a valuation of $20bn (£14.7bn).
“All the while the UK retains its valuation arbitrage and remains cheap.”
Data from FE Analytics shows Threadneedle UK Equity Income made 156.4% over the past decade, compared with gains of 115.1% from its sector and 110.7% from its benchmark.
Performance of funds vs sector and index over 10yrs
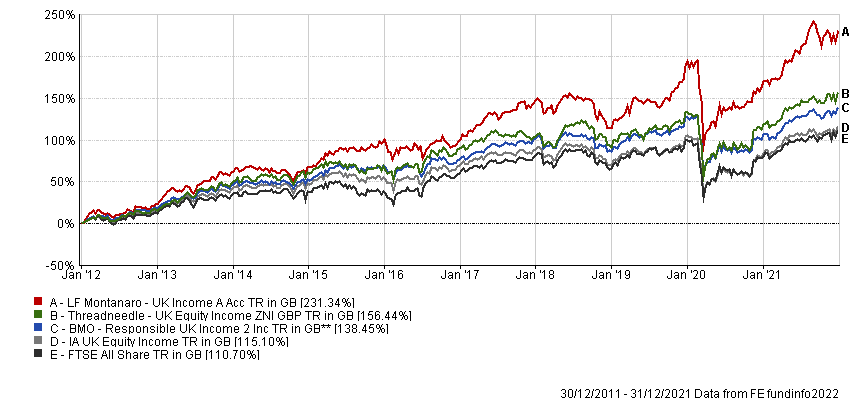
Source: FE Analytics
Although LF Montanaro UK Income hasn’t beaten its sector quite as often as Threadneedle UK Equity Income, it has more than made up for this in terms of total returns – 231.3% over the past decade.
This fund differs from most of its peers through a high weighting to mid and small caps and the integration of environmental, social and governance (ESG) considerations into its process.
On the one hand, this means it may lag behind its peers if there is a rally in oil & gas stocks, for example; however, it also means it can add diversification to a portfolio by avoiding some of the largest dividend-paying industries.
The team at Square Mile Investment Consulting & Research said Charles Montanaro and Guido Dacie-Lombardo, who head up the fund, were “sensible managers who appear to successfully blend youth and experience, as well as genuine humility and a passion for investing”.
“This is further bolstered by the wealth of knowledge provided to the managers by the specialist small- and mid-cap analyst team, and the highly collegiate approach, which we have a high regard for,” it said.
“The process has been designed to highlight high-quality growth companies that can grow sustainably over the long term.”
BMO Responsible UK Income also takes ESG considerations into account, which manager Catherine Stanley said leads her towards the lower end of the market-cap spectrum.
Stocks eligible for inclusion in her portfolio must have a positive impact on society and the environment. After that, the focus is on longevity and reducing risk. Stanley said these initial screens leave her with an investable list of about 220 UK stocks.
“The list doesn’t change hugely one year to the next, but all names and policies are reviewed on a regular basis,” she said.
“It almost, by default, gives us an above-average quality set of names, as there is, in my mind, a clear correlation between high-quality businesses and those with strong ESG standards.”
While there is a growing trend for companies to boost their ESG credentials, some of them are capable of going backwards in this regard, leading them to drop off the list.
HSBC is one example, with Stanley saying: “It was not able to give satisfactory answers on questions around human rights management in Hong Kong and its approach to climate change and financing of that. HSBC has now exited the portfolio.”
BMO Responsible UK Income made 138.5% over the 10-year period in question.
In the previous article in this series, Stanley’s BMO Responsible UK Equity fund was named one of the most consistent performers in the IA UK All Companies sector of the past decade.
| Name | Fund size (£m) | Yield (%) | OCF (%) |
| BMO Responsible UK Income | 463.3 | 2.9 | 0.81 |
| LF Montanaro UK Income | 70.6 | 2.67 | 0.8 |
| Threadneedle UK Equity Income | 4035.1 | 3.08 | 0.82 |