


Investors in actively managed funds are being hit harder by the 2022 sell-off than those tracking the index, research by Trustnet reveals, despite arguments that active managers are better to able to protect on the downside. 
Fans of passive investment make the argument that the average active fund will underperform over the long run, so investors might as well just track the index. But those in the active camp have long maintained that they have a better chance of protecting investors’ capital during downturns as they can move away from the worst-hit parts of the market or retreat into cash.
However, this claim has come under increasing scrutiny in recent years and with markets currently enduring a broad-based correction because of rising interest rates and other concerns, Trustnet has put the 2022 losses of active and passive funds under the microscope.
Average drawdowns by active and passive funds in 2022
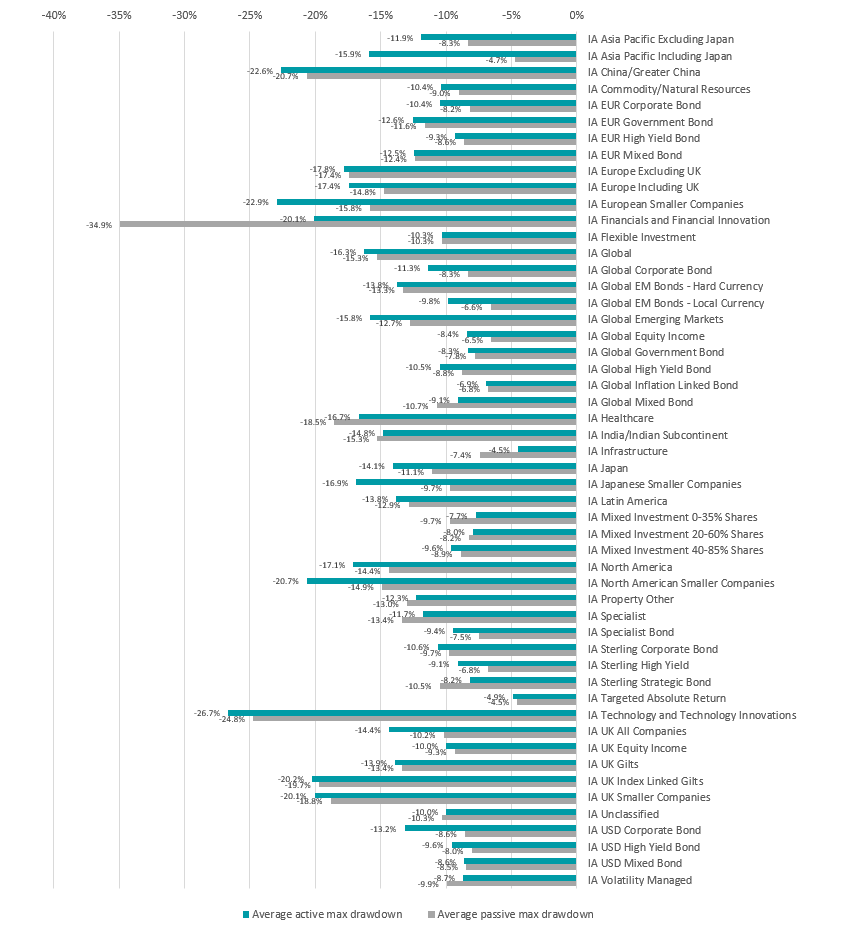
Source: FinXL. Maximum drawdowns in sterling between 1 Jan 2022 and 15 Jun 2022
The chart above shows maximum drawdown in 2022 so far for the average active and passive fund in each Investment Association sector (the handful of peer groups with no passive members have been removed).
There’s a lot of detail in there, but the upshot is that there are only 12 sectors where the average active fund has suffered a smaller maximum drawdown than the average tracker. In the other 40 sectors, active funds lost more than passives.
Among the peer groups where active funds failed to protect capital as well as trackers are some of the most popular in the Investment Association universe, such as IA Global, IA UK All Companies and IA Sterling Corporate Bond.
However, it must be pointed out the above figures don’t differentiate between the various benchmarks that are being used by active and passive funds in each sector: they aren’t really comparing apples with apples.
To address this, we ran the numbers with active and passive funds grouped by benchmark as well as their sector. This resulted in 130 combinations of benchmark and sector and the average active fund had a higher drawdown than passive in 98 of them – or 75%.
The table below concentrates on the most common benchmark in 15 equity peer groups, which is a decent sample size as it covers the maximum drawdowns of 687 active funds and 53 index trackers.
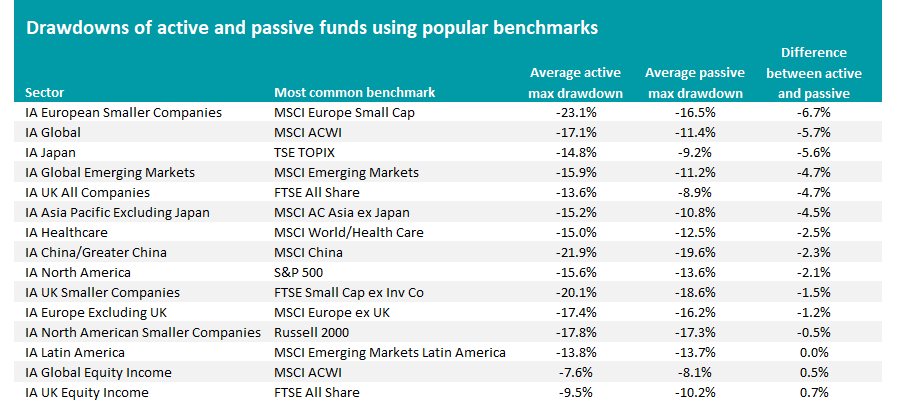
Source: FinXL. Maximum drawdowns in sterling between 1 Jan 2022 and 15 Jun 2022
The results further back up the evidence that active funds have done a worse job than passives during the 2022 sell-off in some of the most popular parts of the market.
Some 13 of these 15 common sector and benchmark combinations above have their average active fund post a higher drawdown than trackers.
The two areas where active funds have done a better job are funds benchmarked against the FTSE All Share in the IA UK Equity Income sectors and IA Global Equity Income funds with an MSCI AC World benchmark This reflects a revival in interest in income investing as investors seek to protect themselves from the impact of higher inflation.
But the 152 active IA Global funds that use the MSCI AC World as their benchmark have suffered an average maximum drawdown of 11.4% this year, some 5.7 percentage points worse than a tracker. Likewise, the drawdown of the 115 active IA UK All Companies funds with the FTSE All Share as their benchmark is, on average, 4.7 percentage points higher than passive’s.
Ending with a look at individual funds, 63% of active funds have a higher maximum drawdown than the average tracker with the same benchmark. The 25 funds that have lagged behind the average tracker with the same benchmark can be seen in the table below.
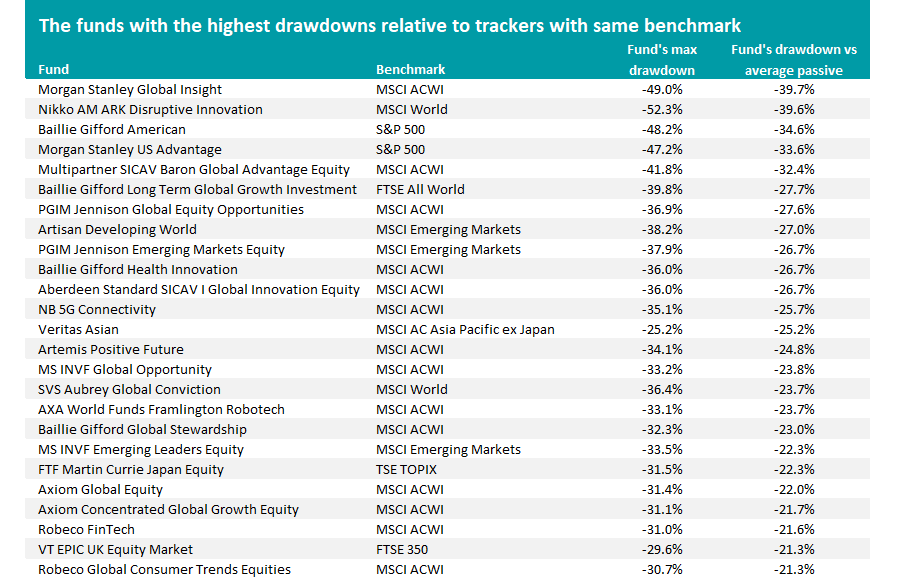
Source: FinXL. Maximum drawdowns in sterling between 1 Jan 2022 and 15 Jun 2022
But while active funds’ drawdowns of 2022 are nothing to be celebrated, there are of course some funds that have been able to defend investors better than a tracker would have. So to end on a positive note, our final table shows the 25 funds that have the smallest maximum drawdowns compared with the equivalent passive.
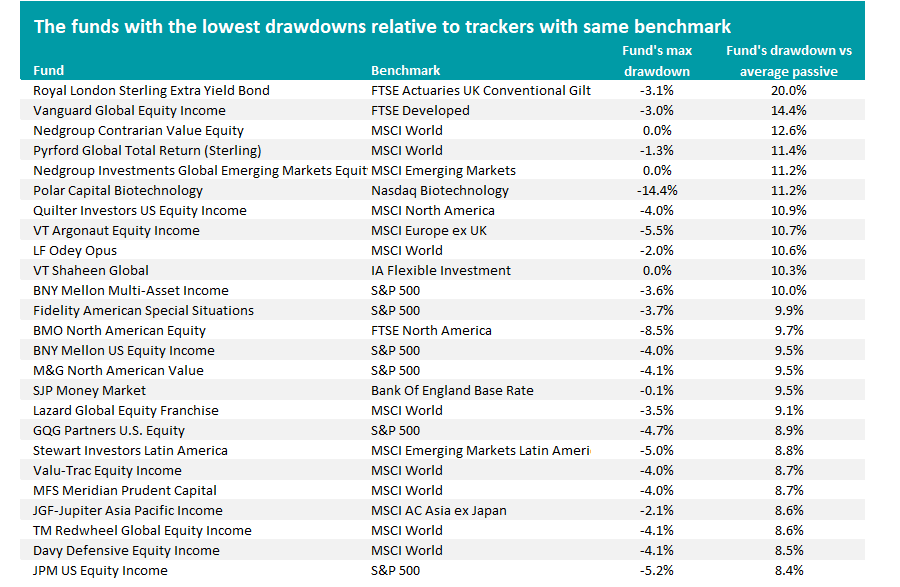
Source: FinXL. Maximum drawdowns in sterling between 1 Jan 2022 and 15 Jun 2022