Value investing as a style has been in the ascendency in 2022 and we are “clearly are in a period where it is likely to outperform growth”, according to Nick Wood, to head of fund research at Quilter Cheviot.
The rotation to value has now been in the headlines for about nine months due to rising inflation and rising interest rates. During this time tech-driven, growth investments have been perceived both as too expensive and not lucrative enough.
Investors have therefore been allocating their money away from growth and towards lower priced stocks with good balance sheets and convincing future prospects, which have rebounded in recent months. These are known as “value” stocks.
The market is pricing in a return to the world of quantitative easing as unlikely, but it is impossible to predict exactly how long the circumstances that caused the current environment will hang around.
Much of the disruption is generally pinned down to the war in Ukraine and Western sanctions on Russia, as well as ongoing supply chain issues from the pandemic: two factors that have no obvious timeline.
For those that believe this will continue for some time, Trustnet asked Wood to design a value portfolio.
It should be noted that he would not recommend a portfolio completely tilted to value and that diversification was key to long-term success. “Of course, these trends can just as easily reverse,” he said, although he added that given the current state of affairs “investors may want to consider their options when it comes to the funds within their portfolios”.
He chose five funds, each with exposure to a different geography, including in order of weighting: the US (40%), the UK and Europe (15% each), emerging markets (20%) and Japan (10%).
Given the growth nature of many US equities, it might surprise to see America at the top of the list. But the portfolio is still underweight in the US, Wood explained.
It is also overweight in the UK, with the goal to benefit from the recent excellent performance of the energy and natural resources companies in the FTSE 100.
“Given the makeup of the MSCI All Country World Index, this portfolio has less exposure to the US as it is filled more with growth names as opposed to value. The portfolio also has an overweight to the UK which has done well year-to-date compared to its geographical rivals, in part as a result of the energy and natural resources companies that sit atop the FTSE 100 and have benefitted greatly from the high inflation rate.”
He also warned: “It should be noted however, that these funds are quite volatile and have the capability of deviating from their respective benchmarks.”
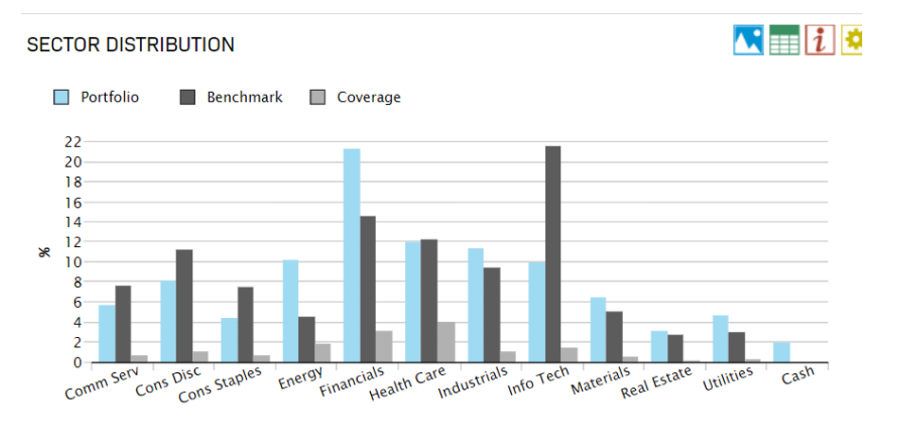
Sector-wise, Wood cut down on technology by more than 50% compared to the benchmark, and diverted that amount to financials (7 percentage point higher than the benchmark), energy (10% instead of 4%), industrials, utilities and materials. He also added a 2% cash exposure.
Sector distribution in Wood's portfolio

Source: Quilter
His choice for the UK market is Schroder Recovery. The fund had a very strong 2021, ranking fifth place in its UK All Companies sector over one year, but slipped into the second quartile over three months and is in the bottom quartile over one month.
Wood said it is “a good play for the UK market, [as it] continues to do well from rising yields, although the team does not rely on interest rates to get good returns”. Over one year, it is up 7.7 percentage points on the benchmark.
Looking at the US funds that are seeing tailwinds from the current macro environment, the choice landed on the BNY US Equity Income fund, which seeks to invest in companies with an attractive dividend yield and sustainable dividend growth characteristics, whilst adhering to a strict valuation discipline.
Wood praised its exposure to financials, as well as energy and materials, which are an advantage when commodity prices and interest rates go up like they are now.
“The fund will typically have 40 to 60 investments and targets a yield of 1.5x that of the market”, he noted, and the historic yield was 1.5% at the end of April.
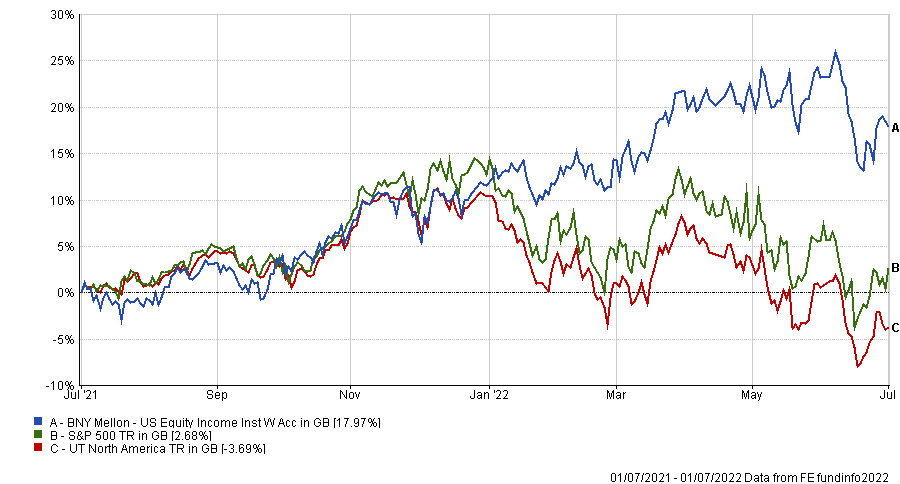
The fund has returned 18% over the last year, compared to a -3.7% performance by its UT North America sector, as shown in the line chart below.
Fund's 1 year performance against sector and benchmark

Source: FE Analytics
On the continent, the Invesco European (ex-UK) Equity fund “offers exposure to undervalued areas of the market and is likely to continue to benefit from the current market environment,” said Wood.
The fund is overweight in energy and banks, again areas that are benefiting from the rise in energy prices and growing interest rates.
It has provided top-quartile results in its Europe Excluding UK sector over three, six and 12 months, as well as 10 years.
Wood would expect this performance to continue and admired manager James Rutland, “who sees Europe in a good place as demonstrated by a green agenda, fiscal policy and a healthy level of consumer savings”.
Moving on to emerging markets, Wood picked the diversified all-cap emerging markets fund Pacific North of South EM All Cap Equity.
It is positioned for higher inflation to continue and has a value bias whereby “value is determined not simply by low multiples, but by looking at the country’s cost of capital of where the company operates and directly incorporating that into each individual company's equity risk premium”, he said.
Over two years, the fund is up 17 percentage points against its FO Equity Emerging Markets sector, and in the latest fund factsheet, the manager attributed the outperformance to commodity stocks in Latin America and holdings in Korea.
Finally, Wood highlighted a “hidden gem”: M&G Japan. This value fund has significant engagement on issues of corporate governance and has managed to consistently remain in the top quartile of its sector UT Japan over 10 years and as well as over shorter and medium terms.
It was taken over by Carl Vine in 2019 and since he stepped in, “we have seen solid outperformance in two very extreme periods and his track record in his previous employment is strong,” said Wood.
“One of the USPs of the fund is the use of external consultant Dr Yanagi; a professor and current CFO at Eisai. He was also an architect of the Japanese corporate governance code. He is used as both a consultant and to engage with Japanese companies where a well-known Japanese national is deemed more likely to succeed.”
| Fund | Sector | Fund size | Fund managers (s) | Yield | OCF | Launch date |
| BNY Mellon US Equity Income | IA North America | £179m | John C. Bailer | 2.1% | 0.82% | 06/12/2018 |
| Invesco European Equity (UK) | IA Europe Excluding UK | £2,429m | John Surplice, James Rutland | 2.4% | 0.93% | 12/11/2012 |
| M&G Japan | IA Japan | £219m | Carl Vine, Dave Perrett | 1.2% | 0.55% | 03/08/2012 |
| Pacific North of South EM All Cap Equity | FO Equity - Emerging Markets | £524m | Matt Linsey, Kamil Dimmich | 4.0% | 1.00% | 02/03/2018 |
| Schroder Recovery | IA UK All Companies | £1,009m | Nick Kirrage, Kevin Murphy | 1.6% | 0.89% | 02/08/2011 |


