


More than one-third of funds in the Investment Association universe are sitting on losses over a three-year time horizon as 2022’s market turbulence continues to push portfolios into the red, analysis by Trustnet shows.
High-profile headwinds such as surging inflation, interest rate hikes, the war in Ukraine and fears of a looming recession have caused stocks, bonds and many other financial assets to sink since the start of the year.
According to FE fundinfo data, around 85% of the 5,066 funds in the Investment Association universe have made a negative return since the start of the year, with around half of these loss-making funds down by more than 10%.
But what impact is 2022’s market volatility having on longer-term returns? After all, many investors accept that performance can dip over the short term and instead pay more attention to how a fund is holding up over three or five years.
In this research, Trustnet looked at funds’ three-year track records to see how many are showing a negative return and how this looks compared with the past two decades.
The short answer: 36.3% of funds made a loss over the three years to the end of October. This represents a tenfold increase since the start of the year – going into 2022, just 3.6% were losing money over three years.
% of Investment Association funds making a loss over three years
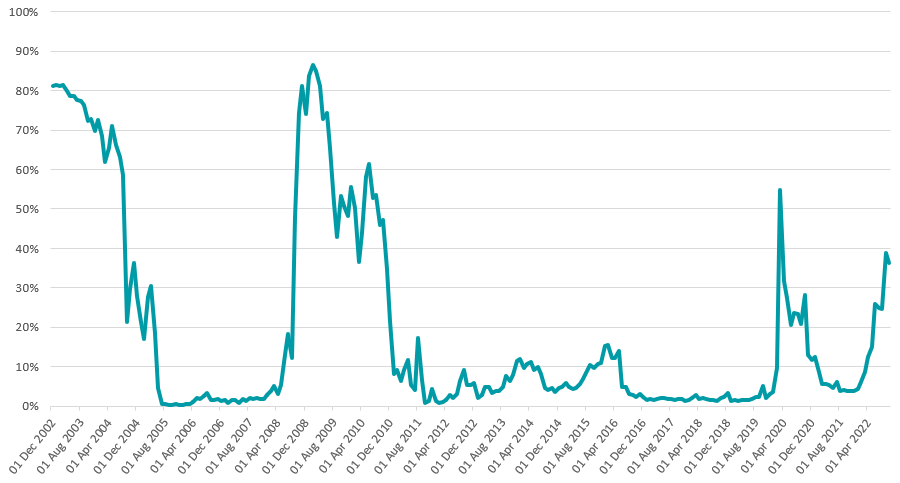
Source: FinXL
The above chart show the percentage of the Investment Association universe making a three-year loss at the end of each month, going back to the start of the millennium.
It’s important to note that this analysis does not suffer survivorship bias – we’ve included the track records of funds that have closed during this period to give an accurate reflection of the industry’s performance over time.
As can be seen from the chart, having more than one-third of the industry handing their investors a negative three-year return is not ideal but it is far from the worst result we have seen over the past 22 years.
At the start of the Covid pandemic in 2020, 54.8% of funds were down on a three-year view following the incredibly rapid bear market that took hold when the lockdowns started.
Of course, this was followed by an equally speedy bull market, especially among the stocks deemed to be ‘lockdown winners’, and 2020 ended with just 11.7% of funds showing a loss over three years. Across the 12 months of 2021, the industry average was 5.7% of funds being down over three years.
The 2008 global financial crisis proved to be much more challenging and harder to recover from. Our data shows that by the end of September 2008 47.8% of funds were down over three years and this peaked with 86.5% posting a loss for the three years to the end of Feb 2009.
But the share of funds making losses over three years remained in the double-digits until the end of 2010 – between June 2008 and December 2010, 54.1% of funds reported a negative three-year return on average.
It remains to be seen which of the two events highlighted above – the pandemic’s quick bounceback or the financial crisis’s drawn-out slump – this year will be most like, although the likelihood of further rate hikes and a global recession hardly bode well for funds.
% of funds making a loss over three years to end of Oct 2022, by Investment Association sector
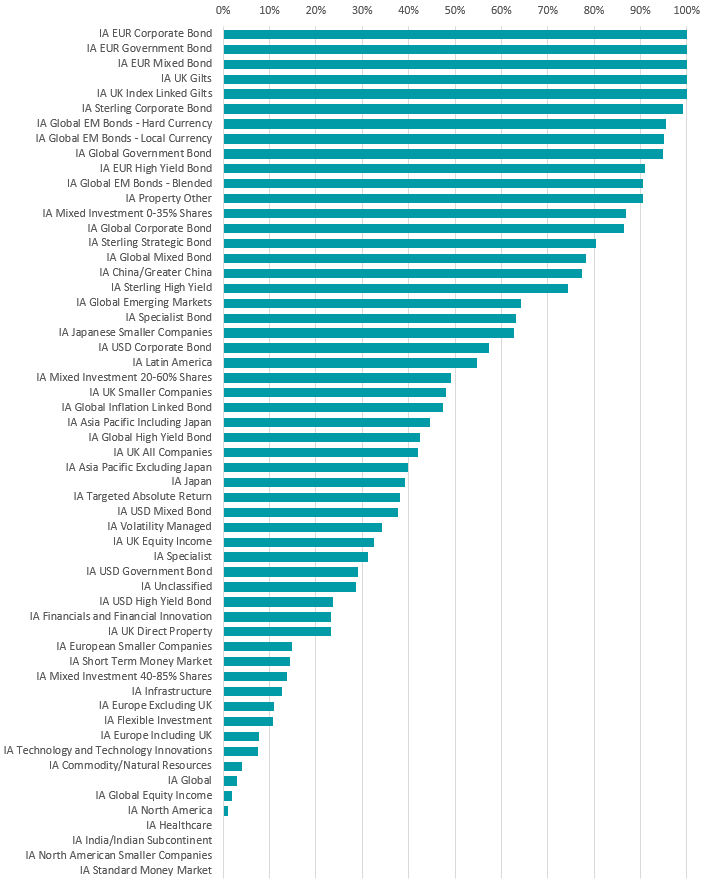
Source: FinXL
The above chart shows what percentage of funds in each sector is currently making a negative return over three years, to highlight where the losses are at the moment.
Every fund in the IA EUR Corporate Bond, IA EUR Government Bond, IA EUR Mixed Bond, IA UK Gilts and IA UK Index Linked Gilts peer groups is in the red on a three-year view, with sterling investment grade bond funds and emerging market debt strategies not far behind.
Fixed income in general has been hard hit by 2022’s events as higher inflation and rising interest rates tend to make bonds less attractive to investors. But equities have not been immune.
IA UK All Companies is a popular sector with UK investors as it offers exposure to the domestic market but just under 42% of its members are down over three years. In the IA Global sector – the largest peer group in the Investment Association universe – only 2.9% of funds are reporting a three-year loss.
However, there are just three sectors - IA Healthcare, IA India/Indian Subcontinent and IA North American Smaller Companies – where every single fund is currently showing a positive three-year return.