






More than half of active equity funds beat the market when stocks sold off in July, Trustnet research shows, reversing more than a decade of underperformance, at least for now.
FE Analytics shows that 52.1% of active funds in the Investment Association universe's 21 equity sectors outperformed their peer group's most common benchmark last month (albeit with many posting losses). This compares with just 31.6% that outperformed over the previous 12 months, a swing of 20.5 percentage points.
The sector with the largest improvement was IA Global Equity Income, where 92.6% of funds outperformed the MSCI AC World in July, up 70 percentage points from 22.6% in the 12 months prior.
It was followed by IA UK All Companies (56.3% outperforming, up 45.7 points), IA UK Equity Income (59% outperforming, up 39.3 points), IA Global (61.9% outperforming, up 40.4 points), IA Europe Excluding UK (62% outperforming, up 36.7 points) and IA North America (54.2% outperforming, up 26.5 points).
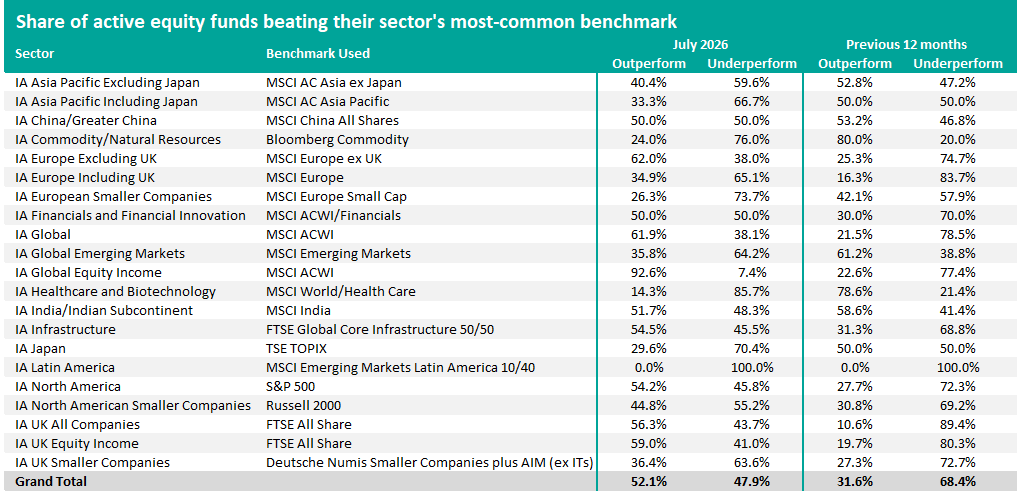
Source: FE Analytics. Average return in sterling.
Active funds have struggled to beat the market for more than a decade, largely down to the fact that the biggest stocks have risen the most and left the average stock far behind. Active managers tend to hold less of the largest companies than the market does, creating a headwind when – as has been the case for some time – the biggest names are leading.
Alex Paget, a manager on the Downing Fox fund-of-funds range, said: "Lately it's been extreme. We've been through one of the narrowest, most one-directional markets in living memory, with AI beneficiaries hoovering up all the returns and pretty much everything else getting ignored.
"The US is the poster child here – the S&P 500 has never been more concentrated and the biggest names (Nvidia et al) have also been the biggest AI winners. Add in stocks that were already sizeable getting an AI-capex rocket boost (Micron, Intel) and the concentration problem compounds itself."
But while the US might be the "poster child", the same concentration pattern is playing out across other regions: TSMC, SK Hynix and Samsung in emerging markets, Europe's so-called Granolas, a handful of large FTSE 100 names including HSBC, Shell, Rolls-Royce and AstraZeneca, and Japanese heavyweights SoftBank and Tokyo Electron all dominate their respective markets.
While these concentrated markets have been in bull mode for several years on the back of the AI trade, July came with a broad reversal of this. Semiconductor stocks fell sharply from 22 June and the decline spread into every index with heavy AI exposure.
Active managers who had lagged for months simply because they held diversified portfolios rather than concentrated AI bets held up once AI-heavy benchmarks started falling. Many had exposure to software, which had already fallen out of favour and become cheap, as well as to sectors overlooked for lacking an AI angle such as consumer names, healthcare and banks, which held up better through the reversal.
Small-cap stocks also began performing more strongly around the same time, giving active funds a further boost.
"To be clear, this isn't a blanket defence of active managers. But it does make sense that a manager convinced of a stock's quality would keep buying it as it got cheaper on nothing but investor apathy. That cost most of them in May and June – and paid off handsomely in July," Paget said.
Some of the funds that were behind the market in the 12 months before July but made high returns last month include Schroder UK Mid 250, TM Brickwood Global Value, SVS Dowgate Cape Wrath Focus, Lindsell Train Japanese Equity and Wellington FinTech.
Performance of 50 biggest stocks, cap-weighted index, equal-weighted index and average global fund over 10yrs
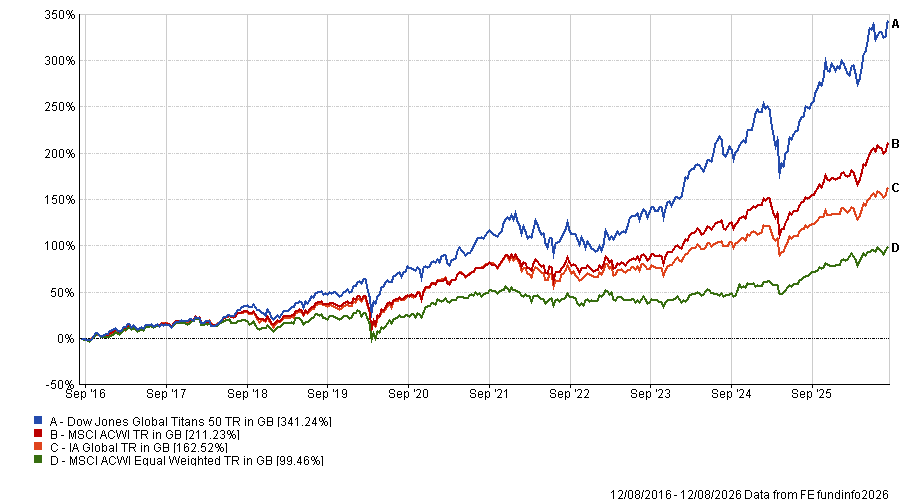
Source: FE Analytics. Total return in sterling between 12 Aug 2016 and 12 Aug 2026
However, one month is a very short timeframe on which to judge performance and may well be a blip in the longer-term trend of active funds underperforming the market (and their index-tracking rivals).
The chart above shows that the Dow Jones Global Titans 50 index (made up of the biggest companies in the world) has made more than 340% over the past decade, while the market-cap-weighted MSCI AC World index is up 211%.
While the average IA Global fund has lagged far behind these mega-cap-dominated indices, it has outperformed the broader market, represented above by the MSCI AC World Equal Weighted index.
For active outperformance to continue, there needs to be more dispersion in the market, as the biggest stocks also being the best-performing stocks is "about as unhelpful a backdrop as it gets for anyone trying to differentiate from the index", according to Paget.
While sceptics might write active managers off because of their extended underperformance of the market, the fund-of-funds manager pointed to two data points that could spark some hope.
"The first is the 2000s. The dotcom bubble and the march towards globalisation had inflated the largest, most 'does-everything-everywhere' companies to enormous index weights by the late nineties," he said.
"When that unwound, it wasn't only the dot-com names that suffered – big stocks generally de-rated from historically high valuations, while smaller, cheaper companies held up better in the early-2000s bear market and then thrived in the recovery. That's a large part of why the noughties are remembered as a golden era for stock-picking."
A smaller but sharper example comes from Denmark. Novo Nordisk's obesity-drug boom pushed the pharmaceutical company to around a fifth of the Danish index by 2023, a weighting local active managers could not match.
Not a single active Danish manager beat the local index in 2021 or 2022, and only 3% did in 2023, according to the SPIVA Europe Year-End 2025 Scorecard. Novo Nordisk's share price then fell by more than half after running into competition problems.
The proportion of active Danish managers beating the index jumped to 97% in 2024, then reached 100% in 2025. "Same managers, same index, wildly different-looking skill. It's a useful reminder of how much 'manager skill' (taken on average) is really just index composition in disguise," Paget said.
It's worth noting that the Downing Fox funds that Paget runs with Simon Evan-Cook only invest in active equity funds, so they have skin in the game; Paget conceded his argument could be written off as "self-interested cheerleading".
But he finished: "We're not blind defenders of the whole active fund industry – plenty of managers deserve the criticism they get, which is precisely why we spend so much time trying to find the ones who don't.
"But look at where we are on valuations: the top of the market looks expensive (and so, by extension, does the index), while the 'everything else' bucket – whether that's the unloved majority of large-caps or smaller companies more broadly – looks good value by comparison.
"History doesn't repeat exactly but it rhymes often enough, and on that basis we think active managers are closer to a genuine tailwind than the brutal headwind they've been fighting for the best part of a decade."