


US stock markets ended yesterday at all-time record highs, with the S&P 500 index closing at 4,850 while the Dow Jones ended the day at 38,001.
On Friday last week, the S&P 500 index had hit a first record high, which was eclipsed again on Monday. It was the first time since 2022 the index had broken these levels.
Axel Rudolph, senior market analyst at IG Group, attributed the peak to “a buying frenzy in artificial intelligence (AI) related stocks”, as well as confidence that the US Federal Reserve will achieve a soft landing.
Kristina Hooper, chief global market strategist at Invesco, also said last week’s rally was led by the booming tech sector. “It started in semiconductors, with very positive guidance from Taiwan Semiconductor, and spread to tech stocks in general. The drivers were excitement over the potential for better tech earnings, as well as more excitement over the potential for AI. That then led to more bullish sentiment overall and helped pull up stock prices in a variety of sectors.”
Hooper also pointed to the positive tone of several recent data announcements, such as December’s better-than-expected retail sales, and initial jobless claims, which were at their lowest levels since September 2022.
“US consumer inflation expectations for the year ahead, as measured by the University of Michigan Survey of Consumers, have fallen dramatically in the last several months, from 4.5% in November to 2.9% in January,” she added.
The key question for investors will be whether the market has further to run, or if it is starting to top out. Rudolph believes the former. “Given the bullish momentum which accompanied the rally to record highs, further upside is likely in store with the Dow aiming for the 40,000 region and the S&P 500 for the 5,000 mark,” he said.
Performance of the Dow and S&P 500 over 3yrs
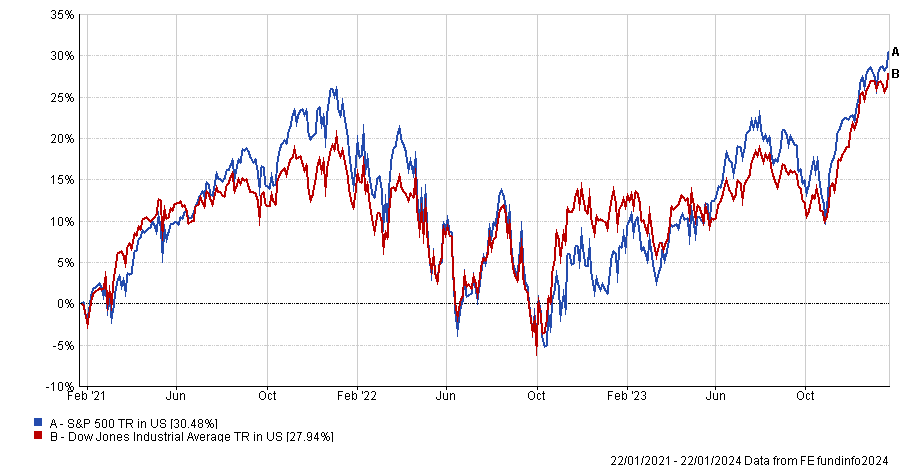
Source: FE Analytics
But not all were convinced. Stephen Innes, managing partner of SPI Asset Management, expects momentum to cool down this week: “After an AI-generated bull run, a Goldilocks sentiment lift from the University of Michigan survey, and a challenging January summit climb, rally momentum has slowed at the start of the week as investors enter the thick of tech earnings season.
“Simultaneously, a series of central bank meetings in various parts of the world may keep investors on their toes. While no significant changes are expected in developed market monetary policy, guidance will be closely observed, especially from the Bank of Japan.”
Alex Campbell, head of communications at Freetrade, went even further, suggesting the rally has already run out of steam. “As we've entered 2024, we've seen cracks begin to emerge. That broad based market rally that swept up beaten down small caps alongside the ‘Magnificent Seven’ has cooled. Signs of hot inflation have been taken as bearish for stocks. Despite stretching to hit new highs (for the first time in a couple of years), the steam has really fallen out of this rally,” he said.
Yet few predict a complete correction at this stage, with John Plassard, senior investment specialist at Mirabaud Group, arguing that the new high does not necessarily mean the market will fall back.
The pie charts below show how many times the S&P 500 has finished down by more than 10% over different periods, after each of the more than 1,201 all-time highs recorded since 1950.
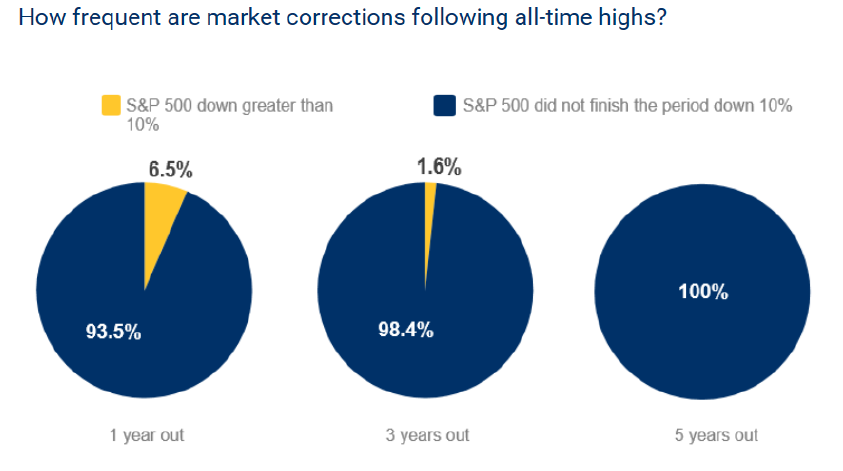
Sources: Mirabaud, RBC GAM, Bloomberg
“One year after each historic peak in the S&P 500, market corrections of more than 10% occurred only 6.5% of the time. As the time horizon lengthens, market corrections become even rarer,” Plassard explained. “In fact, the S&P 500 has never lost more than 10% at the end of a 10-year period following one of its all-time highs since 1950.”
Will the Magnificent Seven continue to lead the way?
Going long the Magnificent Seven is still the most crowded trade, according to the Bank of America’s January Global Fund Manager Survey, yet Phil Haworth, head of equities at Aegon Asset Management, thinks the dominance of the Magnificent Seven is likely to wane.
“The odds seem stacked against continued mega-caps leadership. At a combined 29% of the S&P 500 market cap, they beat the pre-Covid 40-year high by a full five percentage points,” he said.
“We believe the Magnificent Seven may continue to perform well, especially those like Nvidia and Microsoft, which are driving the development of AI, but we should absolutely expect greater market breadth in 2024.”
Should investors reduce their US equity exposure?
Ernst Knacke, head of research at Shard Capital, suggested investors consider going underweight US equities but noted it is too soon to make that move just yet.
“A ‘market weight’ in US equities is probably too high from an overall portfolio perspective, but the near-term tailwinds would suggest it’s too early to take profits. Momentum signals remain strong. The disinflationary tailwind will continue to support sentiment and with inflation down significantly over the past 18 months, it’s reasonable to expect a more dovish central bank tone,” he explained.
Hooper, meanwhile, recommended shifting US allocations towards the lower end of the market capitalisation spectrum as smaller companies should “perform well in the coming months”.
Mark Sherlock, head of US equities at Federated Hermes, was also bullish on US small and mid-caps (smid).
“The US economy, and importantly the US consumer, remain healthy and the Fed’s fight against inflation appears to be on track. Earnings estimates for the S&P 500 in 2024 are low double digits, and higher for US smid,” he said.
“US smid looks attractive from a valuations perspective and is trading at a historically large discount to US large-caps. Some potential for volatility remains, however, and having a bias to quality remains important to mitigate against unexpected outcomes.”