


The UK first set an inflation target in 1992, shortly after the UK left the European Exchange Rate Mechanism, when sterling was linked to the Deutschemark.
Five years after that, the new Labour government granted the Bank of England independence in setting policy, reaffirming and slightly revising the inflation target.
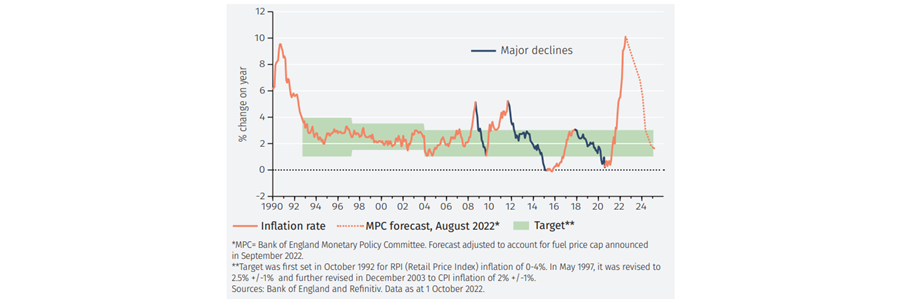
Although the inflation target has been met most of the time, we are now seeing the fourth major overshoot during the inflation targeting period. Yet there are three charts that suggest the current rate of inflation might be short-lived.
UK target inflation
Encouragingly, all three previous overshoots were followed by major declines in the rate of inflation. It is instructive to assess the reasons why. These include: much lower oil and commodity prices were a feature of all three periods; two of the three were during a UK recession; none involved higher interest rates; and sterling weaken against the US dollar in all.
On that basis, the current combination of lower oil and commodity prices; a likely recession; and higher interest rates seems a sure recipe for inflation coming back down. It may well constitute overkill.
UK inflation target
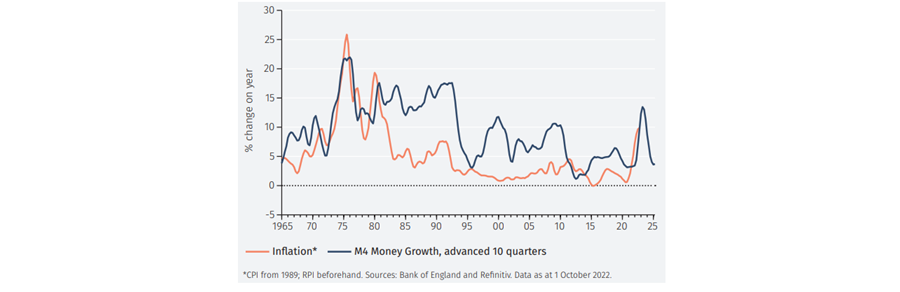
Broad Money Growth
At the same time the Bank of England was given independence in 1997, banking supervision was taken away from it (and transferred to the Financial Conduct Authority). One criticism of that move was that the Bank became too technocratic, concentrating on inflation targeting itself and less on assessing monetary growth and credit conditions – driven, primarily, by the banking system.
Banking supervision was handed back to the Bank after the global financial crisis, but even since then there has been a notable absence of attention paid to money and credit growth. This was of pivotal importance in the assessment of inflation and broader economic prospects in the 1970s and 1980s.
A downplaying, or even a disregard, of it has been a fundamental weakness in the assessment of UK inflation prospects. Faster broad money growth preceded the recent upsurge in inflation; the more recent slowdown supports the case for lower inflation in the future.
UK broad money & inflation
Fiscal-monetary interaction
The government’s September mini-Budget plans, involving a substantial easing of fiscal policy, have now largely been overturned following the adverse financial market reaction: notably, a substantial fall in long-dated government bond prices and in sterling’s exchange rate against the US dollar. The emphasis is now on ensuring fiscal sustainability.
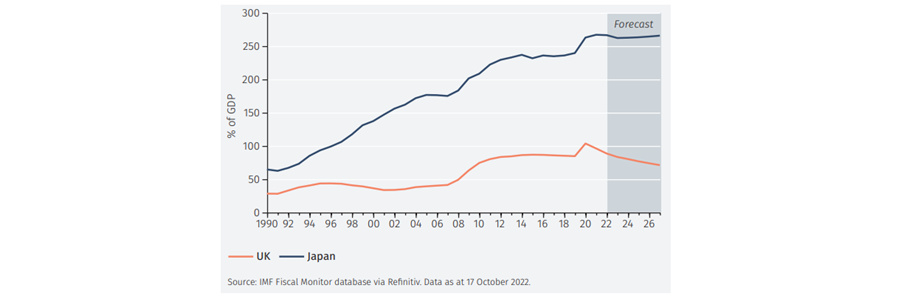
The IMF’s latest forecasts show this is set to be achieved, with government debt steadily falling relative to GDP. It is most unlikely to rise on a multi-year basis, as has been seen in Japan, for example.
Indeed, there is a risk that fiscal policy verges on being too tight, easing the need for monetary policy tightening. Given the swings in policy direction seen in September-October, however, the outlook is uncertain.
UK government debt
Oisin O’Leary is co-portfolio manager of the New Capital Dynamic UK Equity fund. The views expressed above should not be taken as investment advice.