


Long-term investors should be looking for opportunities outside of the narrow band of stocks that have been responsible for the bulk of 2023’s performance, analysts have warned, as the market could flip again.
The MSCI AC World index has made a total return of just under 10% over 2023 so far but, as the chart below shows, growth stocks have made around double this. Value stocks, on the other hand, are up by less than 1%.
Performance of indices over 2023
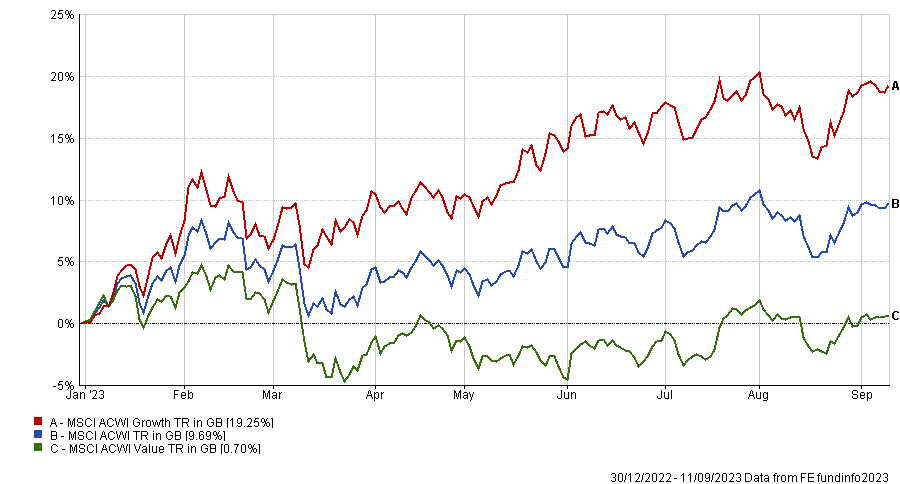
Source: FE Analytics
Adam Norris, an investment analyst in the multi-manager team at Columbia Threadneedle Investments, pointed out that this situation has been in play for a number of years now after growth stocks – especially those in the US large-cap tech space – thrived in the era of ultra-low interest rates. While they tanked in 2022, they have bounced back this year on the back of excitement around artificial intelligence.
Over the same past years, the S&P 500 has been the leading major stock market, delivering returns that significantly outpace those in the rest of the world. However, the S&P 500 excluding tech stocks has made a return around half that of the wider index – less than the return from the MSCI Europe ex UK index.
Returns within the US market over this period have been dominated by just a handful of companies: Apple, Alphabet, Amazon, Microsoft, Netflix, Meta and, more recently, Nvidia. These are the same companies leading 2023’s returns.
“The S&P 500 is now close to the most concentrated it’s been in the past 40 years. With 22% of the market in just the top five stocks, versus a 30-year average of 13%, investors should be aware they are tying up almost a quarter of their capital in a handful of companies when passively buying the market,” Norris said.
“Whilst returns year-to-date would suggest otherwise, we reflect whether the next cohort of dominant stocks could be found outside of the incumbents. Whether it is innovative healthcare for an ageing population, or more traditional sectors such as industrials in a higher cost of capital environment, history suggests it would be an anomaly for the same top 10 stocks by market capitalisation to continue to outperform for multiple decades.”
Norris added that an analysis of the dominant investment theme in each decade can be an enlightening exercise.
Top 10 stocks by market capitalisation
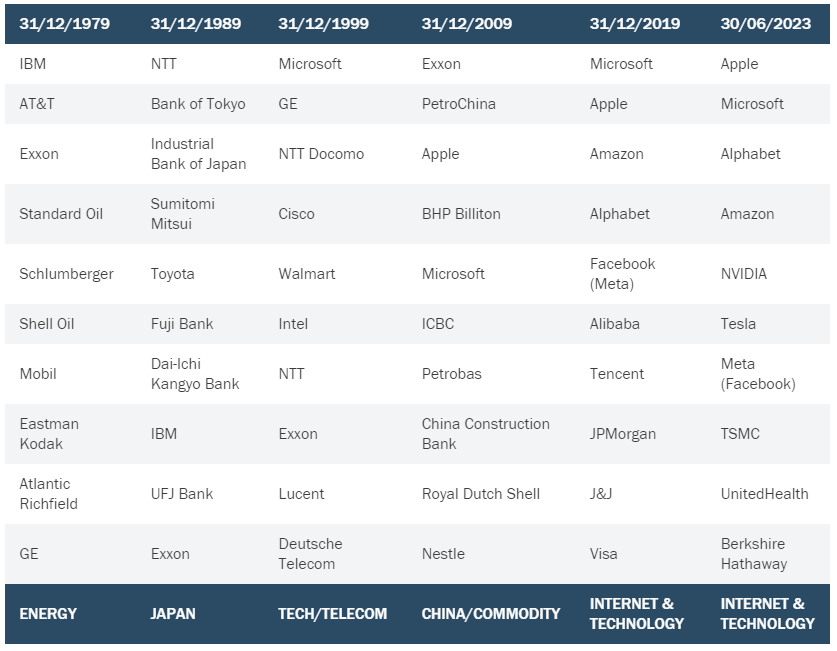
Source: Strategas Research Partners
The largest companies of the late 1970s were those that benefitted from an oil price shock, while the 1980s were ruled by Japan. In 1999 there was the dotcom bubble (and subsequent bust) and the 2000s were driven by a Chinese-led commodity super cycle. Only Microsoft has survived in the top 10 since the turn of the century.
“No doubt each theme-of-the-decade would have felt unique, structural and seductive at the time. Global internet and technology stocks accounted for eight of the top 10 global companies at the end of the 2019. Yet despite only being just a third of the way through the next decade, the two Chinese-listed technology companies within the cohort have already been placed in the sin bin and are now a long way from the top 10,” he explained.
“The more appropriate takeaway is perhaps the larger companies become, the more difficult it can be to maintain previous growth rates. The only thing investors can usually bank on is change and new winners to emerge.”
Kevin DiCiurcio, head of the Vanguard capital markets model research team, agrees that now appears to be a good time to look outside of the US growth stocks that are leading the market.
The chart below shows Vanguard’s estimates of the fair value of US value shares relative to US growth shares. When the historical ratio exceeds the upper limit of the estimated fair-value range, the chance for market-beating returns appears to be larger in growth shares while a ratio below the lower limit of the range favours value stocks.
Value shares’ aggregate price/book ratio divided by growth shares’ aggregate price/book ratio
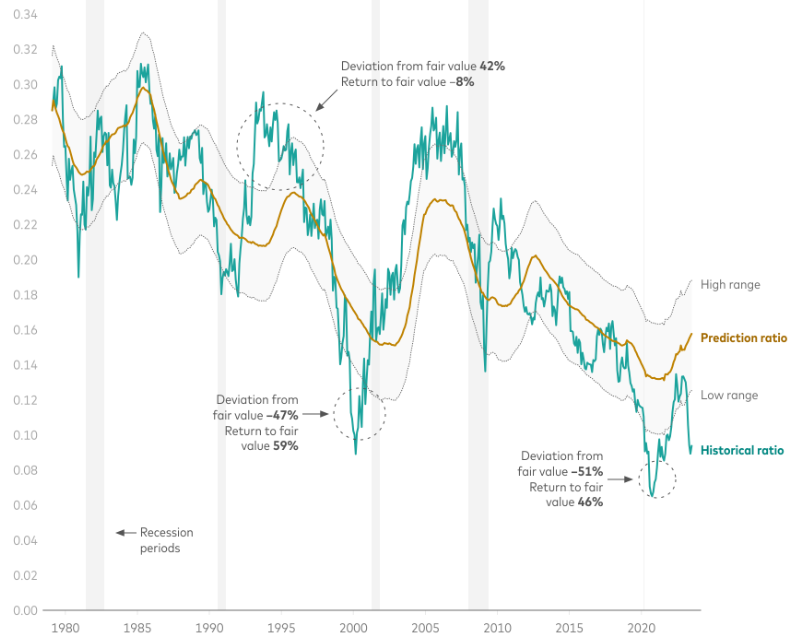
Source: Vanguard
“The value/growth relationship is at an extreme, and very similar to 2020,” DiCiurcio explained. “Now, as then, investors in aggregate are very enthusiastic about growth shares – notably, technology shares – and seem to have limited interest in value shares, including financial, industrial and healthcare companies.”
However, the chart shows that value stocks have tended to outperform growth after such extreme valuations. For example, value stocks outpaced growth by 59 percentage points after the peak of the tech bubble in 2000 and reached fair value in around a year while they outperformed by 46 percentage points over about 20 months more recently when the world started to unlock from the Covid pandemic.
DiCiurcio added that another source of optimism on value stocks over growth comes from analysis of the dozen US business cycles since 1980. The table below shows how value has outperformed during economic recoveries, if history is anything to go by.
Average monthly return advantage of value over growth across US economic cycles
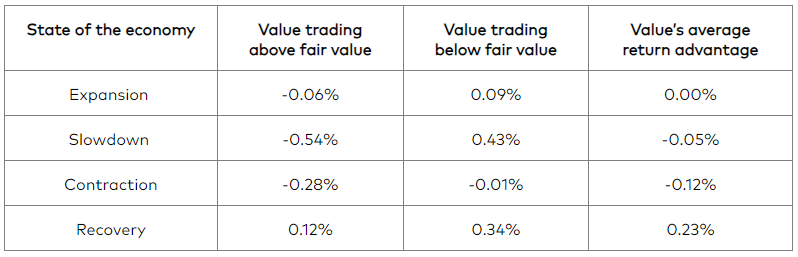
Sources: Vanguard
“To be sure, the state of the business cycle alone is an unreliable signal of the relative returns between value and growth. However, when value has traded below its fair value – as it is doing today – it has historically enjoyed a performance edge in all but contractionary economic phases. Even then its shortfall relative to growth has been a scant -0.01%,” he finished.
“If you believe that the US Federal Reserve may have engineered a soft landing – that we’re going to sidestep a recession and that the economy’s next move is an acceleration – the case for value as part of a balanced portfolio is strengthened.”