


Last year – like every other – presented investors with a unique blend of challenges and opportunities, including (but not limited to) central banks’ battle with inflation, conflict in Europe and the Middle East, and the rise of groundbreaking new technologies.
As we enter 2024 and prepare for its coming unique circumstances, now is an opportune time to review the market movements of 2023. With this in mind, below are six charts showing what happened to asset classes, investment styles, stock market industries and other factors over the past 12 months.
Performance of asset classes in 2023
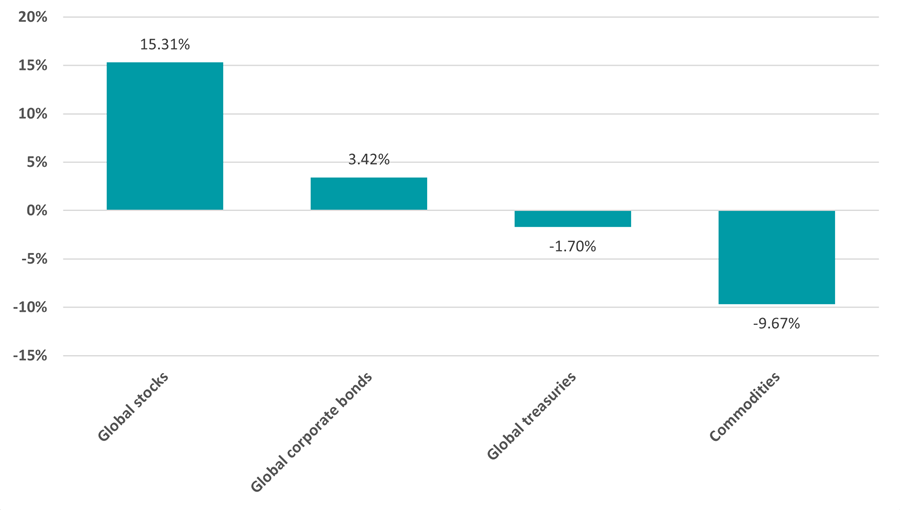
Source: FinXL
Starting with asset classes, it’s clear that stocks led the way with a 15.3% total return (in sterling terms) from the MSCI AC World index. This went somewhat against expectations at the start of 2023, when many investors were worried that rising interest rates would push the global economy into recession – an eventuality which failed to materialise.
Bonds had a more lacklustre showing, despite many going into 2023 thinking they were in for a strong year. Corporate bonds outperformed government bonds but both enjoyed a significant rally in the fourth quarter on the back of expectations that interest rates had peaked.
The worst performing asset class, however, was commodities with a close to 10% drop in the broad-based S&P GSCI index. Commodity prices have rocketed in recent years but were brought down in 2023 as major economies tried to ease inflation.
Performance of investment factors in 2023
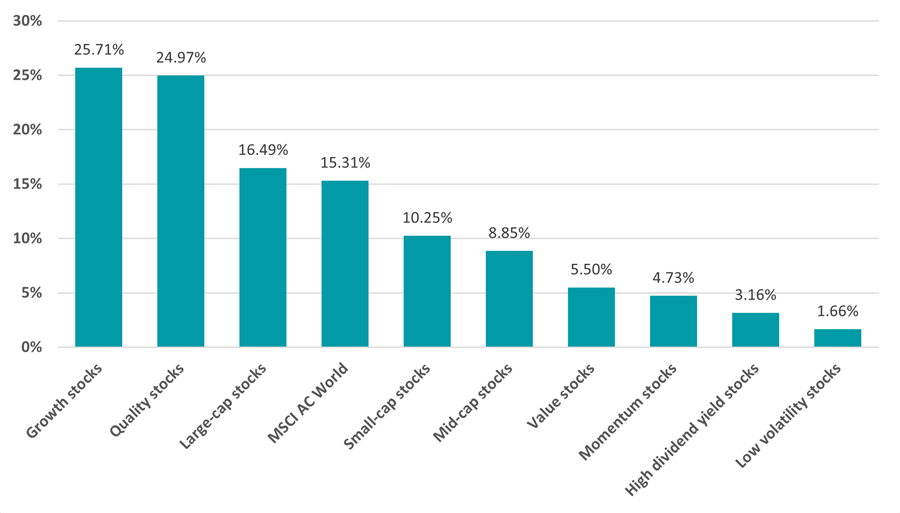
Source: FinXL
Although the MSCI AC World index delivered a 15.3% return last year, the above chart illustrates the differing performance of common factors.
Growth stocks outperformed by a wide margin, with their indices returning around 25% in sterling terms as investors returned to these companies as hype around tech stocks linked to artificial intelligence (AI) grew and interest rate hikes started to moderate. Value lagged behind after the style’s brief outperformance in the previous year.
Meanwhile, large-caps outperformed small- and mid-cap equities after subdued economic growth made investors reluctant to venture into the riskier parts of the stock market.
Performance of geographies in 2023
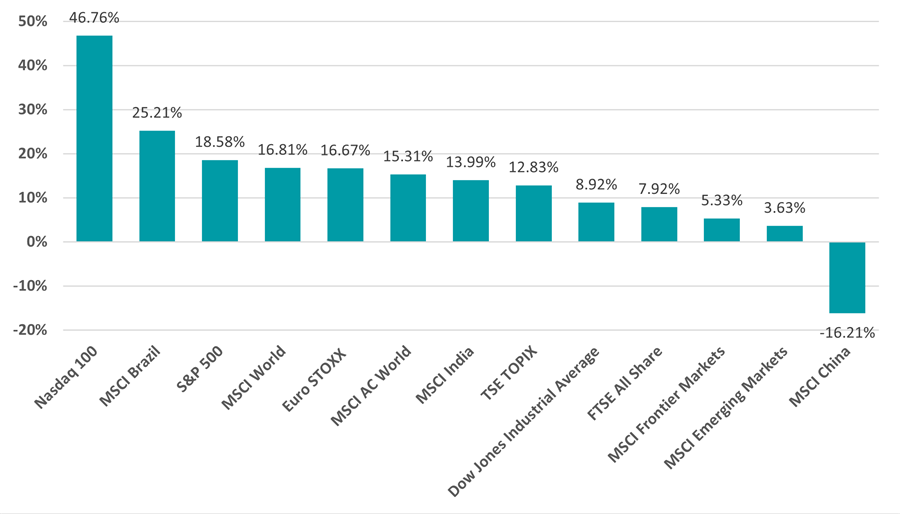
Source: FinXL
There was also a significant difference in performance according to geography, with the developed market-focused MSCI World index outpacing the MSCI Emerging Markets index by 13 percentage points. This reflects the heavy sell-off that hit Chinese stocks when the country’s post-Covid recovery faltered.
Last year’s strongest performance came from the Nasdaq, which gained close to 47% in sterling terms and reached a record high when investors flocked to stocks with exposure to AI; the so-called Magnificent Seven stocks (Alphabet, Amazon, Apple, Meta Platforms, Microsoft, NVIDIA and Tesla) were the standout performers of 2023. This is in stark contrast to the 9% rise in the Dow Jones, which is comprised of ‘old economy’ stocks rather than those on the cutting edge of tech.
The UK had another weak year. While the 7.9% total return from the FTSE All Share beat the emerging and frontier markets indices, it is somewhat behind the advances made by stocks in the US, Europe and Japan.
Performance of industries in 2023
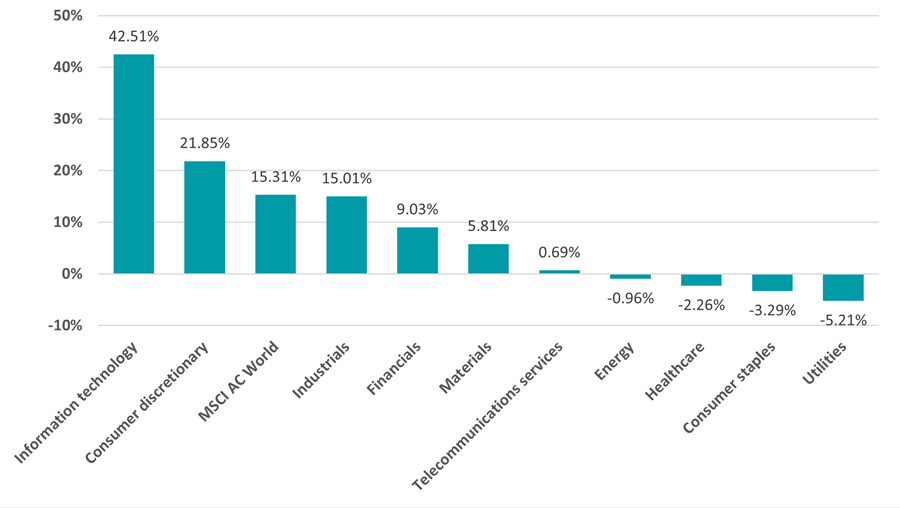
Source: FinXL
The above chart reiterates how narrow the leadership of the global equity market was in 2023 with only two industries making a return higher than the MSCI AC World index.
The MSCI AC World Information Technology index gained 42.5% over the year, reflecting the excitement around AI and investors’ willingness to return to growth stocks, while consumer discretionary stocks benefited from the stronger than expected economy.
Performance of thematics in 2023
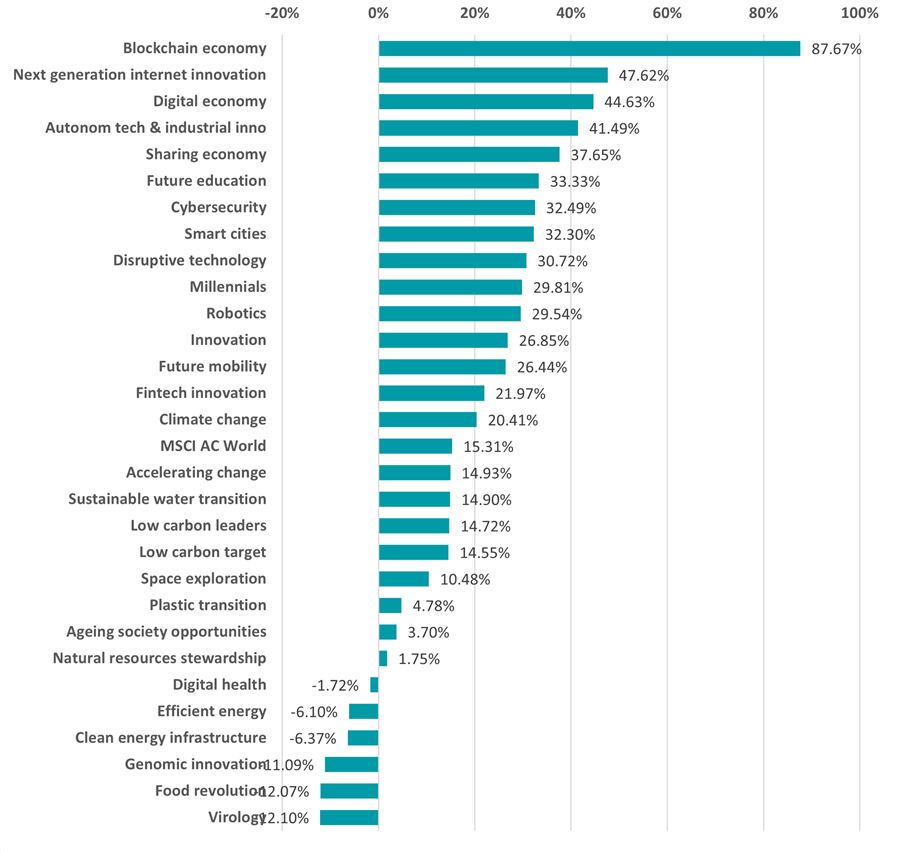
Source: FinXL
Turning to thematic stocks, it should come as little surprise to see that the strongest returns came from those in the tech space. Stocks linked to cryptocurrencies had an especially good year after the price of bitcoin moved from under $17,000 to $45,000.
Most of MSCI’s thematic indices had a positive 2023 although double-digit losses were seen in virology, food revolution and genomic innovation stocks.
Performance of commodities in 2023
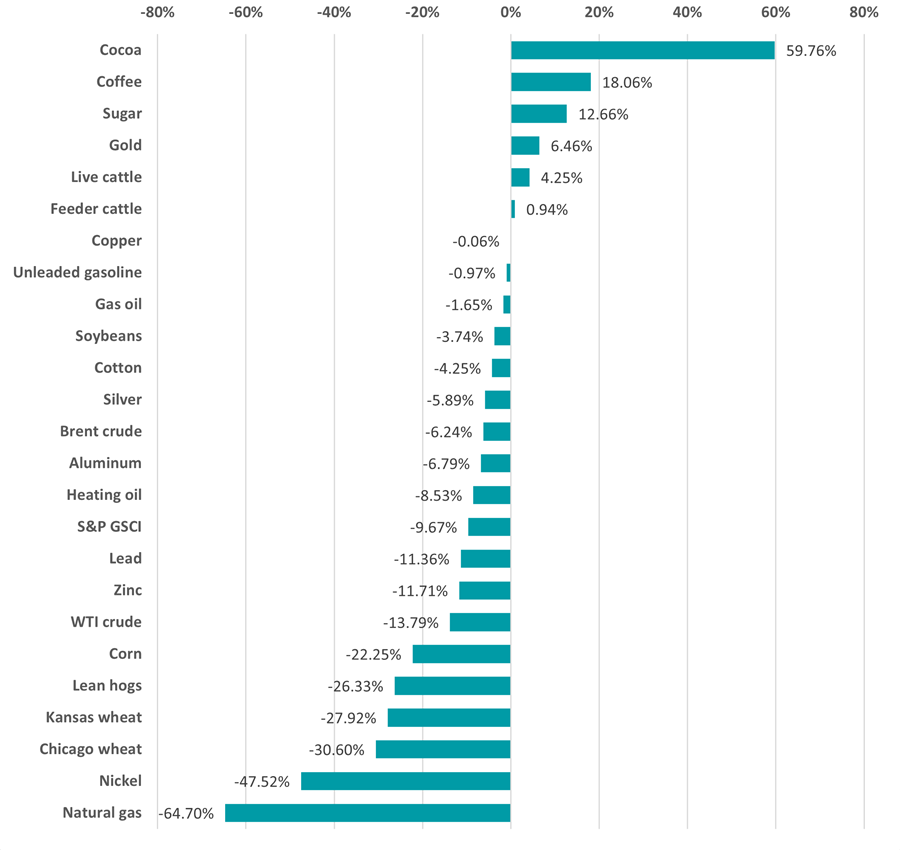
Source: FinXL
The final chart shows the widespread falls in commodity prices last year, after demand for key materials was dented by higher borrowing costs and China’s slower economic growth.
Natural gas prices fell the most, down 65% in sterling terms, while nickel – a key industrial metal – and wheat fell 47% and 30% respectively. A few commodities did rise in price, however, with cocoa, coffee and sugar gaining the most.