


Within the past five years, the global stage has been rattled by a worldwide pandemic, the outbreak of war and mounting geopolitical tensions. Despite this, funds in the IA Global sector have persevered and are up 54.6% on average.
But it has been far from a smooth ride since 2020 and there are few signs that the world is becoming more certain. Indeed, with US president Donald Trump and the rise of nationalist parties across the world, globalisation (the status quo for the past decade or so) is severely under threat.
In such a volatile environment, investors may have no idea which way markets will head. While some believe the good times will continue to roll, others are less convinced. As such, it might make sense to buy funds that have historically managed to deal with both scenarios.
As part of a new series, Trustnet identified funds in the IA Global sector that managed the best returns when markets rose, while also staying strong when markets fell, using the upside and downside capture ratios. Both scores were calculated against the MSCI World index.
An upside capture above 100% means the fund outperformed the MSCI World when markets rose, while a downside capture below 100% means it fell less than the index during downturns.
Some 95 funds achieved this feat versus the MSCI World. As such, we have increased the scrutiny on this sector, by looking at those with top-quartile upside and downside capture ratios, thus comparing the funds against their peers as well as the market.
As shown in the table below, Trustnet identified nine funds that fit this higher bar.
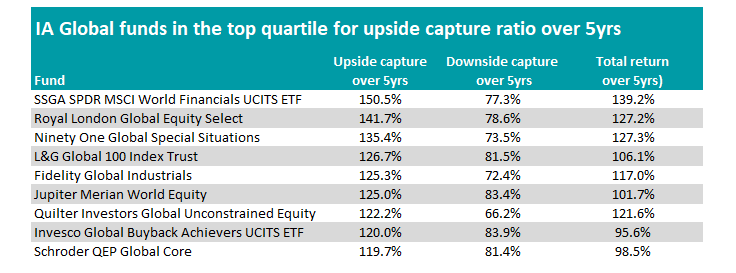
Source: FE Analytics
Arguably the most balanced was the £122.1m Ninety One Global Special Situations fund, which was third on the upside capture ratio (135.4%) and on the downside capture ratio (73.5%).
Launched in 2007 and managed by Alessandro Dicorrado since 2016, it has managed top-quartile returns over one, three and five years but is in the third quartile over 10 years, gaining 181.6% over the decade.
It aims to invest in companies that are undervalued by the market, with jet engine maker Rolls-Royce and Magnificent Seven stock Meta among the Ninety One fund’s top 10 positions.
Performance of the fund vs sector over 5yrs
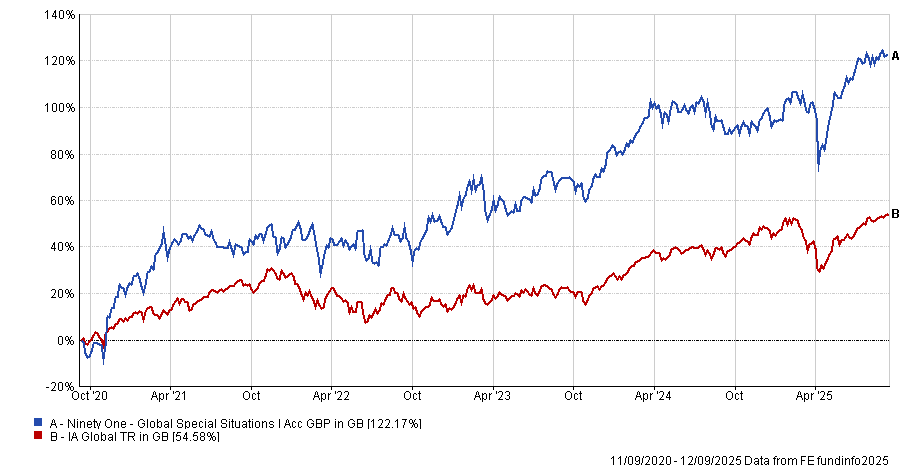
Source: FE Analytics
While the active approach delivered a strong balance of upside and downside performance, passive strategies also made a mark – particularly those targeting specific sectors.
Indeed, the fund with the highest return over the past five years was the SSGA SPDR MSCI World Financials UCITS ETF.
Tracking the MSCI World Financials 35/20 Capped Index, the $320m exchange-traded fund (ETF) made 139.2% over the past half a decade. Its outperformance has been consistent, with the ETF managing a top-quartile return over one, three, five and 10 years.
It was followed by Ninety One Global Special Situations and Royal London Global Equity Select, the latter of which was subject to a manager change in 2024, with Royal London appointing new hires to the fund after the former team left.
Royal London Global Equity Select is currently managed by Francois de Bruin and Paul Schofield.
It seeks capital growth over seven-plus years, looking to outperform the MSCI World Net Total Return Index GBP by 2.5% per annum over rolling three-year periods.
With an FE fundinfo Crown Rating of five, the £578.9m Royal London Global Equity Select managed an upside capture ratio of 141.7%. which it paired with a 78.6% downside score.
Of the nine funds, Quilter Investors Global Unconstrained Equity was the best option on the downside over the assessed five-year period.
The £152.8m fund was launched in 2014 and seeks to provide capital growth and income and outperform the MSCI All Countries World Index over rolling five-year periods.
It has also managed top-quartile returns over three and five years but sits in the fourth quartile over the decade with a 144.3% gain.
Performance of the fund vs sector over 5yrs
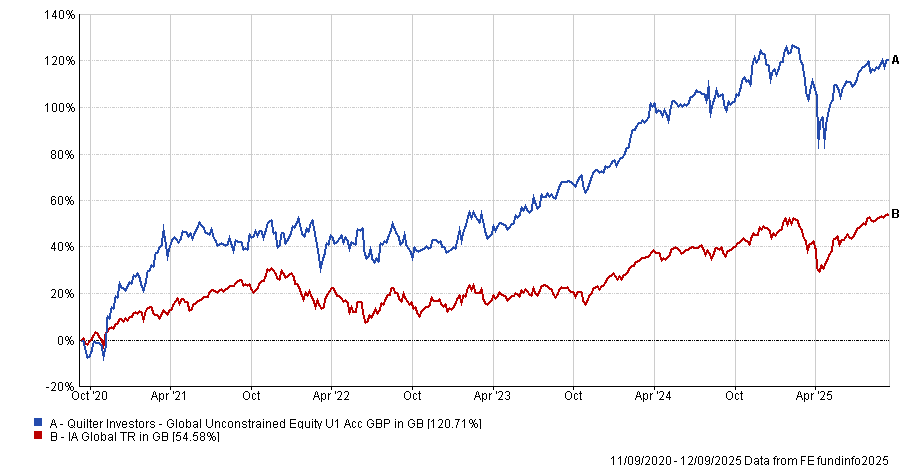
Source: FE Analytics
In comparison, with an almost 106 percentage point difference, Fidelity Global Industrials outperformed the Quilter fund over 10 years, gaining 250.1%.
It was also the second-best fund in the list above on the downside, investing in the equity securities of companies across the natural resources value chain, including Rolls-Royce and oil and gas majors ExxonMobil and Chevron.
More than half (55.7%) of the fund is invested in North America, followed by 22.2% Europe ex UK.
While these funds have proven to weather both sides of the market, some investors may have strong bullish or bearish beliefs from here.
For those in the former camp, it has historically paid off to invest in funds targeting technological innovation, with the three top funds during rising markets – all ETFs – investing within this bracket.
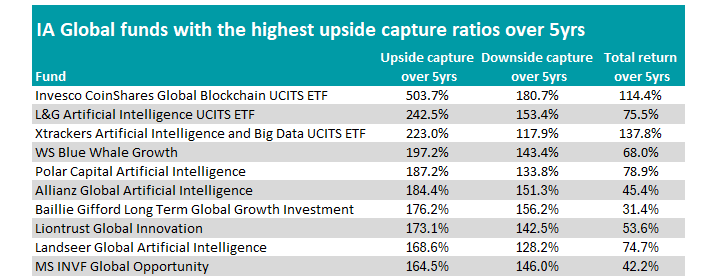
Source: FE Analytics
Invesco CoinShares Global Blockchain UCITS ETF managed a 503.7% upside capture ratio over the five-year period, meaning it made five times the market during good times.
It tracks the CoinShares Blockchain Global Equity Index, which targets companies within the blockchain and cryptocurrency ecosystem. However, it had a downside score of 180.7%.
Meanwhile, L&G Artificial Intelligence UCITS ETF and Xtrackers Artificial Intelligence and Big Data UCITS ETF managed 242.5% and 223% upside capture ratios respectively, although both lost more than the market when global stocks fell. They provide investors with exposure to companies throughout the global artificial intelligence value chain.
Despite its focus on the cyclical energy sector, conversely, Schroder ISF Global Energy protected best when MSCI World fell, able to turn a profit when stocks dropped.
The $333.6m fund was launched in 2008 and is managed by Mark Lacey, Alex Monk and Felix Odey. It also allocates 8.5% to utilities, 4.4% to liquid assets, 2.8% to materials, 2.6% to industrials and 1.5% to consumer staples.
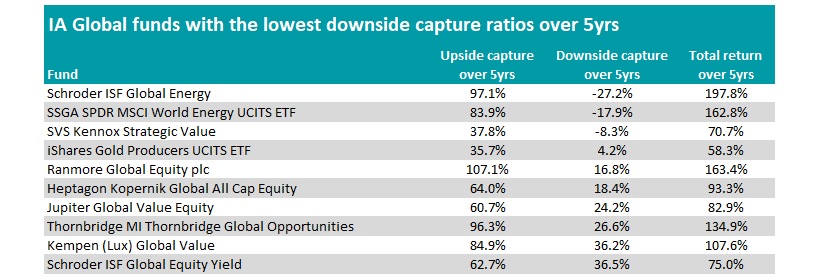
Source: FE Analytics