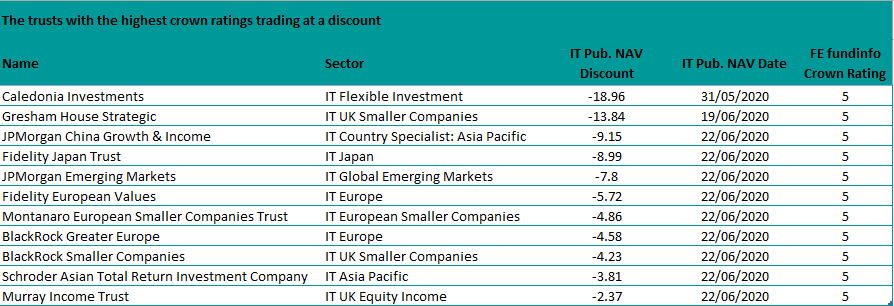
There are a handful of top-rated investment trusts trading at discounts to net asset value, according to research by Trustnet, potentially offering investors an opportunity to buy in at an attractive entry point.
As investment trust shares are traded on the stock market, they can trade at a discount to the net asset value (NAV) of its underlying portfolio when its strategy, asset class or manager is out of favour.
The trusts with the highest crown ratings trading at discount
Source: FE Analytics
Below Trustnet takes a closer look at some of the investment trusts with a five FE fundinfo Crown rating – the top 10 per cent of UK retail funds based on scores for alpha, volatility and consistently strong performance – trading at the widest discounts.
Caledonia Investments
Trading at the widest discount of 18.96 per cent to its NAV in our list (as at 31 May), is the £1.8bn Caledonia Investments trust.
The trust aims to grow the NAV and annual dividends paid to shareholders over the long term by investing in “proven, well-managed businesses that combine long-term growth characteristics with an ability to deliver increasing levels of income” from around the world.
As such, Caledonia Investments invests in four pools (and a range of assets) to achieve this aim, including: Quoted Equity: Capital, Quoted Equity: Income, Private Capital and Funds.
Its Quoted Equity: Capital pool includes companies “that demonstrate excellent operational capability and capital discipline” including names such as tech giant Microsoft, asset manager Polar Capital and drinks company AG Barr.
The Quoted Equity: Income pool, meanwhile invests in top quality, high-yielding names able to grow their dividends, such as Unilever, British American Tobacco and National Grid.
Its private capital holdings include unlisted, UK mid-market companies valued between £25m and £125m; while its fund holdings include private and public equity strategies giving it broader geographic and sector spread.
Caledonia Investments is also one of the Association of Investment Companies’ ‘dividend heroes’, having increased its annual dividend for each of the last 52 years.
Performance of trust vs sector & benchmark over 3yrs
Source: FE Analytics
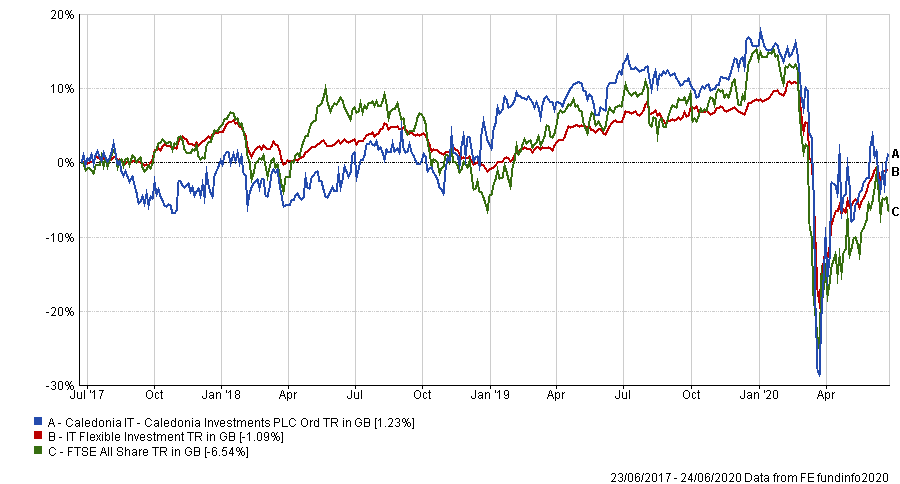
Caledonia Investments has made a total return of 1.23 per cent over three years compared with a 1.09 per cent loss for the average IT Flexible Investment peer and 6.54 per cent loss for the FTSE All Share benchmark. The trust is not geared, has a yield of 2.2 per cent and ongoing charges of 0.88 per cent.
Gresham House Strategic
Next up is the £42.8m Gresham House Strategic trust, the UK equity strategy trading at the widest discount of 13.84 per cent to NAV.
The U strategy is managed by Tony Dalwood and Richard Staveley and uses private equity style techniques in the UK small-cap space, focusing on profitable, cash-generative companies that it believes are “intrinsically undervalued."
Performance of trust vs sector over 3yrs
Source: FE Analytics
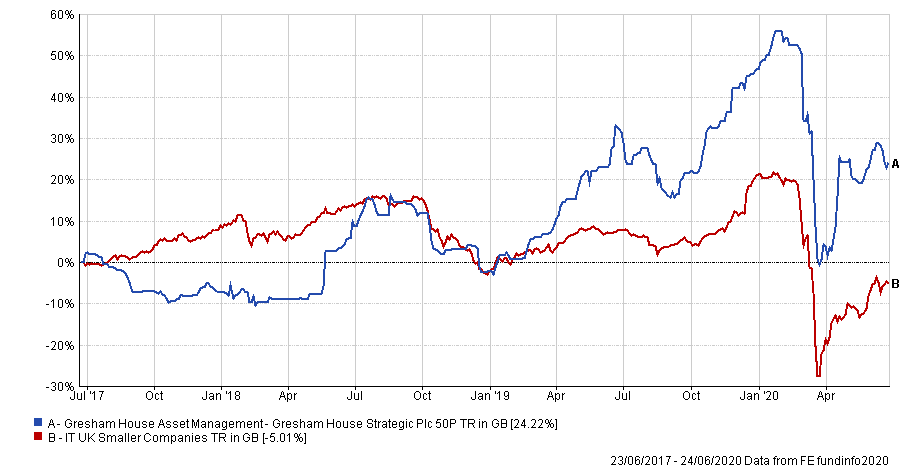
Over three years, the Gresham House Strategic has made a total return of 24.22 per cent compared with a loss of 5.01 per cent for the average IT UK Smaller Companies trust. It trust has a yield of 2.1 per cent, is not geared and has ongoing charges of 3.15 per cent.
JPMorgan China Growth & Income
A slightly different strategy is JPMorgan China Growth & Income, managed by Howard Wang, Shumin Huang, Emerson Yee Shun Yip and Rebecca Jiang.
Trading at a discount of 9.15 per cent to NAV, the £407.1m trust aims to provide long-term capital growth by investing in companies listed in China, Hong Kong and Taiwan. And aims to outperform the MSCI China index.
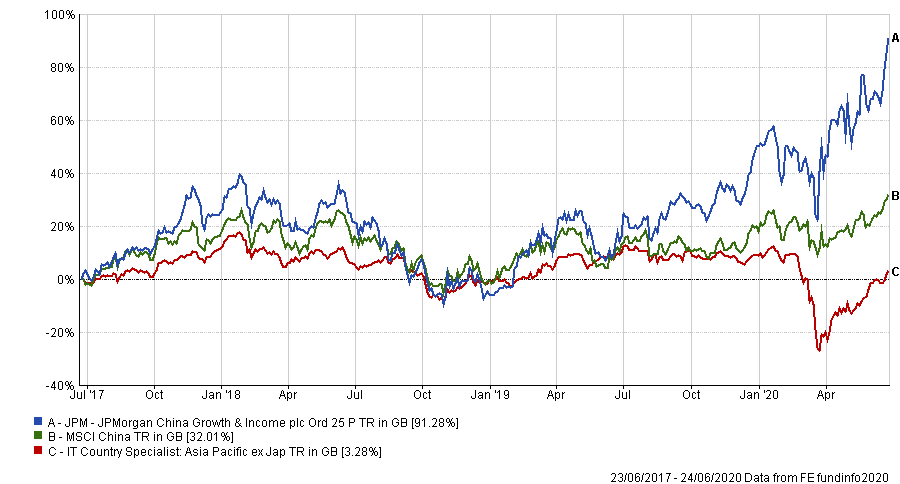
Over the past three years, the trust has returned 91.28 per cent, in comparison to MSCI China which returned 32.01 per cent and the 10-strong IT Country Specialist: Asia Pacific returning 3.28 per cent.
Performance of trust vs sector & benchmark over 3yrs
Source: FE Analytics
JPMorgan China Growth & Income is 8 per cent geared and has ongoing charges of 1.26 per cent.
Fidelity Japan
The only Japanese equity strategy on the list is the £317.2m Fidelity Japan trust trading at a discount of 8.99 per cent to NAV.
Managed by Nicholas Price, who has worked at Fidelity Investments Japan as a portfolio manager since 1999, the trust follows a growth at a reasonable price (GARP) investment approach.
Its 10 largest holdings include Japanese technology companies Olympus, Murata Manufacturing and Keyence, that have been key in driving the performance of the trust. Over the last three years, Fidelity Japan has returned 40.48 per cent compared with 16.13 per cent for the IT Japan sector average.
Performance of trust vs sector over 3yrs
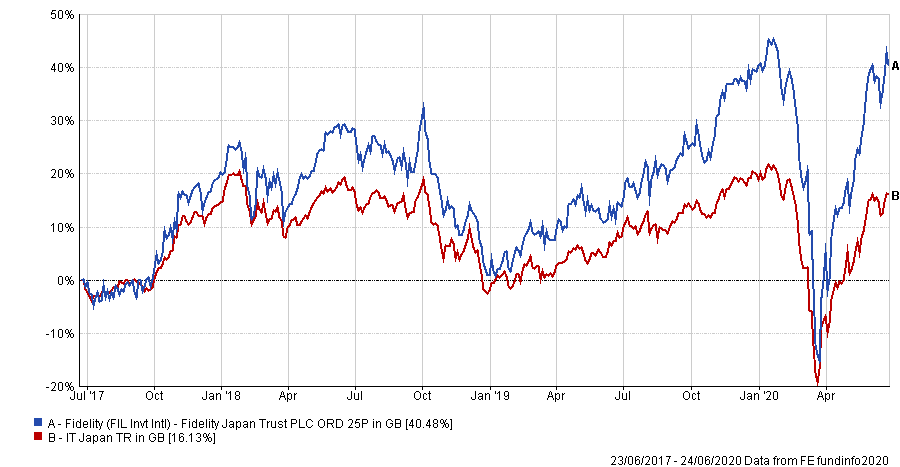
Source: FE Analytics
The trust is 22 per cent geared and has ongoing charges of 0.83 per cent.
JPMorgan Emerging Markets
Finally, the £1.1bn JPMorgan Emerging Markets trust whose objective is to provide long-term capital growth, under the stewardship of Austin Forey, which is currently trading at a discount of 7.8 per cent. A recent amendment to the investment policy allowed for the trust to hold more than 50 per cent of their assets in a certain region if that region was performing strongly in these exceptional circumstances.
Chinese equites make up 38 per cent of the portfolio, with the technology giants Tencent and Alibaba amongst the top holdings.
Increasing exposure to any one region can be risky in terms of a fall in the NAV and declining share price. However, Forey has managed the trust during similar crises and the new investment policy is a temporary measure tailored for this crisis and the limit will likely revert to a 40 per cent maximum for any one region in the portfolio.
The JPMorgan Emerging Markets is not geared and has ongoing charges of 1.09 per cent.


