Asia encompasses a wide range of economies and presents a lot of opportunities for investors looking for exposure to the region.
For example, the IA India/Indian Subcontinent sector has posted some of the Investment Association universe’s highest returns over a one, three, five and 10 years. Over the past decade, the average Indian equity fund is up 228.2%.
While neighbouring China has lost some of its appeal in recent years, with IA China/Greater China funds posting an average loss of 21.4% over the past 12 months, things may be looking up. Jarring policy changes hurt investor sentiment, but the nation is keeping monetary policy supportive just as most other central banks are hiking rates.
In the next instalment of this series, Trustnet shows the IA Asia Pacific Excluding Japan, IA China/Greater China and IA India/Indian Subcontinent funds that were within the top 10% of their peers for alpha, information ratio and total return compared with a representative index over the past five years.
Not only did the funds outperform the index on the above criteria, but they also did so at a below average cost. Investors can therefore access top alpha, a measurement used to calculate a fund’s returns above its benchmark, without it costing the world.
Previously, Trustnet has looked at the cheapest funds offering top alpha, information ratios and total returns in the US, IA UK All Companies, IA UK Equity Income and IA UK Smaller Companies sectors.
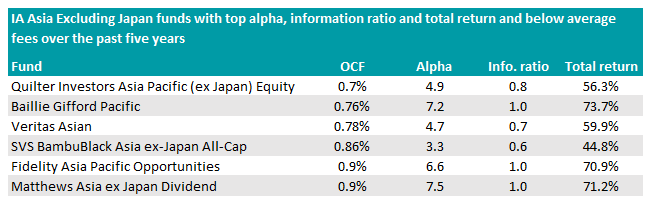
IA Asia Pacific Excluding Japan
The cheapest portfolio that ticked all the boxes in the IA Asia Pacific Excluding Japan sector was the Quilter Investors Asia Pacific (ex Japan) Equity fund, which charged inventors an ongoing charges figure (OCF) of 0.7%.
The £237m portfolio invests all across Asia, with its biggest sectoral weighting in telecom, media & technology assets at 38.9%. This was followed by the next two highest exposures to basic materials and financials, which accounted for 12.1% and 11.3% respectively.
Run by FIL Pensions Management, the fund has made 56.3% over the past five years, outperforming both its average peer and the index by a comfortable margin.
Total return of fund vs sector and index over 5yrs
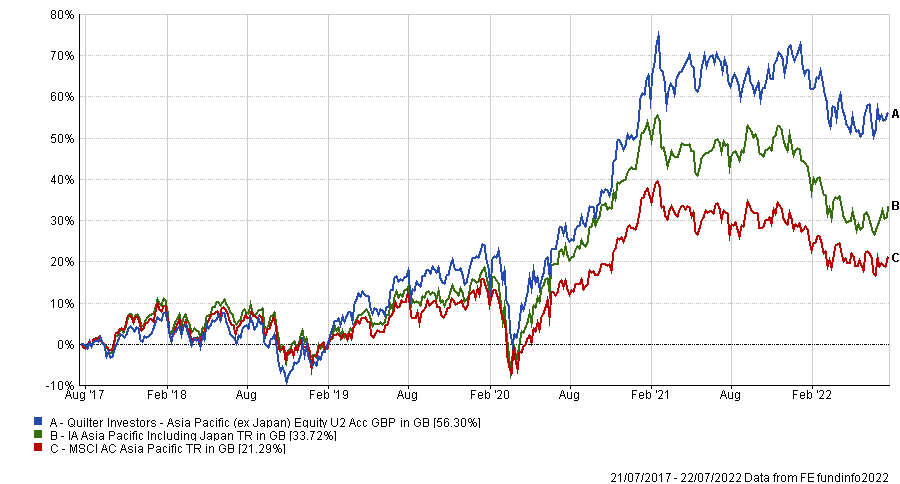
Source: FE Analytics
The Baillie Gifford Pacific fund was the second most affordable portfolio, with a slightly higher fee of 0.76%.
Majority of its assets are held in China, with a 31.6% allocation in the country, but exposure to India was also at a sizable 20.3%.
For the slightly higher price, investors would get the highest return on the list – over the past five years, it was up 73.7%.
FE fundinfo Alpha Manager Roderick Snell has been at the helm of the £2.9bn fund since 2010, and has driven up returns 312% since taking charge.
Total return of fund vs sector and index under Snell
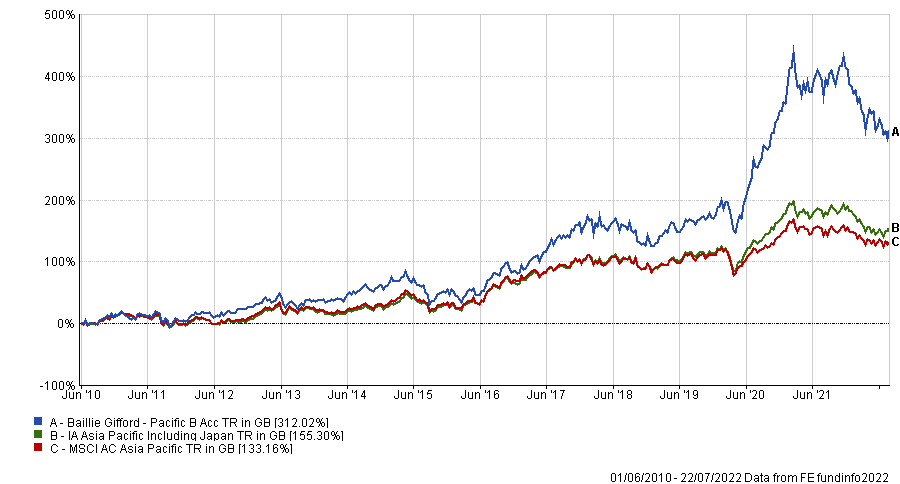
Source: FE Analytics
Baillie Gifford Pacific may have offered the highest total return over the past five years, but Matthews Asia ex Japan Dividend fund had the highest alpha.
For 0.9%, one of the two most expensive portfolios on the list, investors would have had an alpha of 7.5 over the period as well as the second highest total return of 71.2%.
At the same price, Fidelity Asia Pacific Opportunities fund trailed narrowly behind over the past five years, returning 70.9%.
Total return of funds vs sector and index over 5yrs
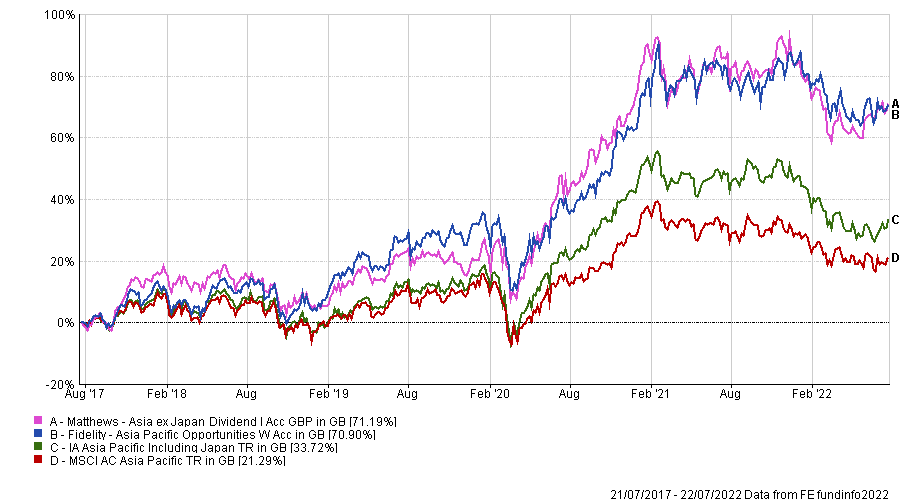
Source: FE Analytics
Performance on both funds closely mirrored one another over the period, although there wasn’t much of an overlap in the top holdings. Each had some of their highest exposure to Tencent and Taiwan Semiconductor Manufacturing, but the rest of their biggest holdings were different.
Regionally, they both had their biggest overweight to China, with Matthews holding 42% while Fidelity had 38%.
It’s also worth noting that both funds had FE fundinfo Alpha Managers running them - Anthony Srom for Fidelity and Yu Zhang for Matthews Asia.
Of all the funds in the list, Matthews Asia ex Japan Dividend had the lowest drawdown since the start of 2022 with a 7.3% drop. Although it wasn’t the highest returner over the longer term, investors were better protected against the recent market rotation with this fund than its peers.
However, the biggest winner over the past five years, Baillie Gifford Pacific, dropped the most in the choppy waters of 2022, falling 15.2% since the start of the year.
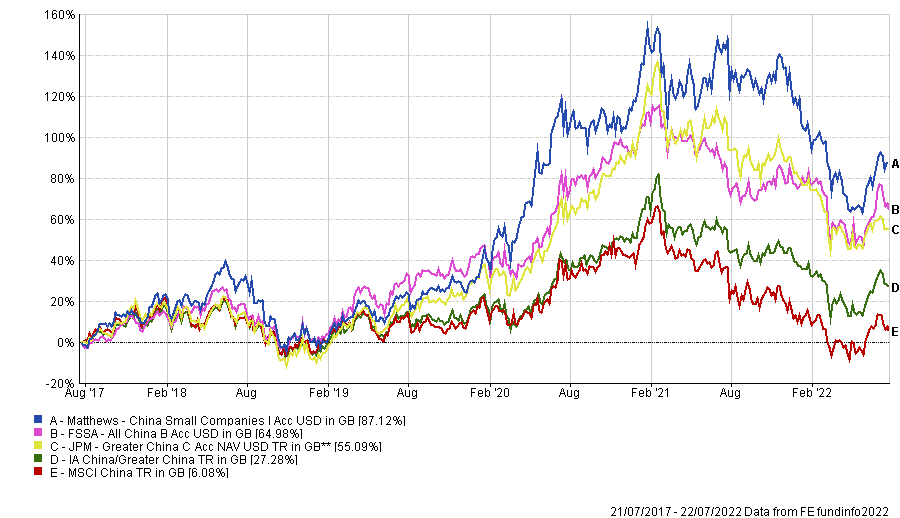
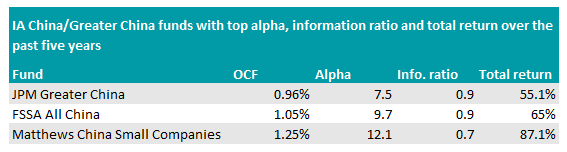
IA China/Greater China
The JPM Greater China fund was the cheapest portfolio in the IA China/Greater China sector that generated top alpha, information ratio and total return.
With an OCF of 0.96%, the $2.1bn (£1.7bn) has its largest overweight to information technology assets – allocations to the sector account for 30.1% of the portfolio holdings, 5.7 percentage points more than the benchmark.
Returns were up 55.1% over the past five years, whereas the FSSA All China fund leapt slightly higher for a more sizable charge.
It performed 9.9 percentage points better, jumping 65% over the period for a 1.05% fee. The portfolio also had the highest information ratio of those on the list at 0.9.
However, investors looking for high alpha and total return could consider Matthews China Small Companies fund if they don’t mind an above average fee.
It was the best performer in the sector over the past five years, leaping 87.1% and beating its peers by 59.8 percentage points. For a charge of 1.25%, some investor may not mind paying more for its 12.1 alpha score.
Total return of funds vs sector and index over 5yrs
Source: FE Analytics
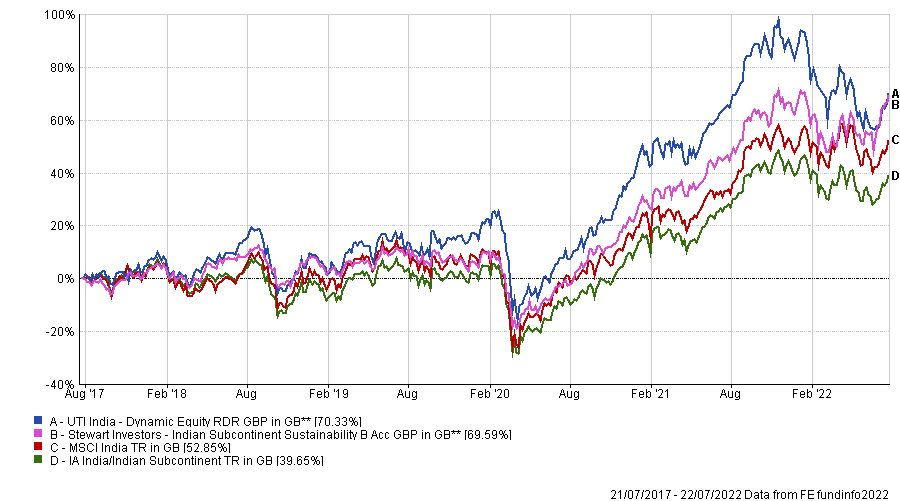
IA India/Indian Subcontinent
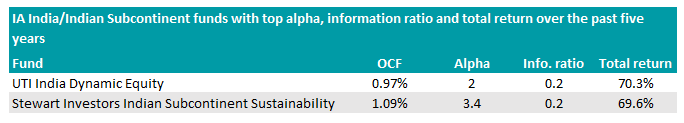
Only one portfolio in the IA India/Indian Subcontinent sector met all of the requirements – the UTI India Dynamic Equity fund.
It had the highest returns in the sector over the past five years, up 70.3%, but dropped to become the worst performer in the past six months, declining 7.9% as markets shift away from growth investing.
Despite its long-term outperformance, investors were only charged a 0.97% fee, making it one of the cheapest in the sector.
The only other portfolio to have rank within the top decile was the Stewart Investors Indian Subcontinent Sustainability fund, but the OCF was above the sector average.
Not only were investors charged more with a 1.08% fee, but its total return over the past five years was lower than that of UTI India Dynamic Equity.
Total return of funds vs sector and index over 5yrs
Source: FE Analytics
That being said, the fund was the best performer in the shorter term, ranking first for total return over the past one to three years. It also had the highest alpha ranking of 3.4.