The average IA China/Greater China fund has disappointed investors over the year to date, when the sector’s -1.9% represented the third-worst total return of all Investment Association sectors.
This might have come as a surprise to those who were expecting the country to fare much better, given the excitement that followed the end of the Covid restrictions and the high expectations around the comeback of the Chinese consumer.
Performance of loss-making IA sectors over the year to date
_MA000009.png)
Source: FinXL
This is no reason to cut your exposure to the market, however, according to Marcus Weyerer, chartered financial analyst (CFA) and senior exchange traded funds (ETF) investment strategist at Franklin Templeton, who said that the underperformance might just be a short-term flip within a positive long-term run.
“We believe that the recovery rally we have witnessed in Chinese shares since late last year has further to go, as the longer-term prospects for equity investors in China continue to improve,” he said.
But the tensions between the US and China remain elevated and are likely to generate more volatility in the market, Weyerer warned.
When constructing their portfolios and balancing their emerging markets risk, investors should make sure to have just as much exposure to China as their conviction tolerates and avoid doubling down on the market without realising it.
In fact, a vast number of emerging market funds have large weightings to China, meaning that their performance will tend to move in tandem with other vehicles with similar exposure.
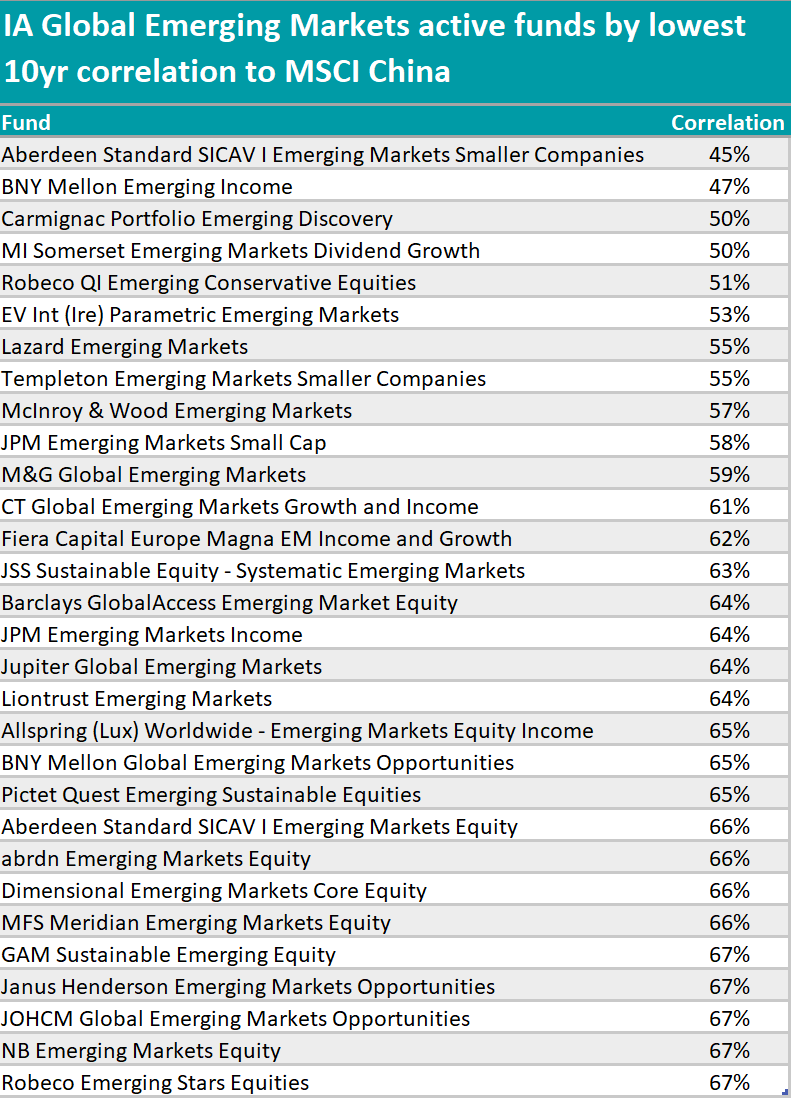
In the IA Global Emerging Markets sector, the average correlation to the MSCI China index over the past 10 years is 68%. Below, we highlight the active vehicles that have kept below this figure.
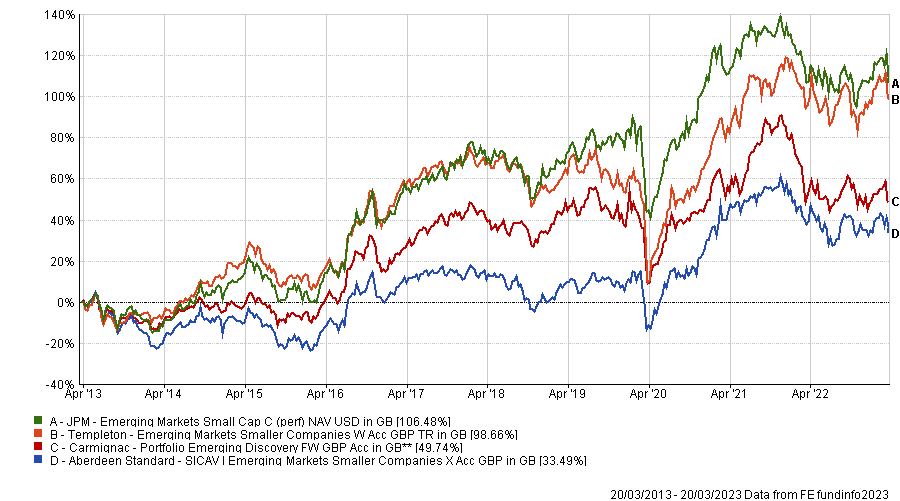
A strong theme on the list is small-caps. The table opens with a smaller companies strategy, Aberdeen Standard SICAV I Emerging Markets Smaller Companies, which has a 45% correlation to the index, while in third position with 50% correlation is the small and mid-cap fund Carmignac Portfolio Emerging Discovery.
A little way down the list, at the 55% mark, is Templeton Emerging Markets Smaller Companies, followed by JPM Emerging Markets Small Cap (58%).
Of the four, the largest is the £1.3bn JPM Emerging Markets Small Cap fund, which is also the cheapest, with an ongoing charge figure (OCF) of 1.06% against the 1.10% of the second-cheapest Templeton Emerging Markets Smaller Companies.
At a performance level, these two funds take turns outperforming each other over one, three and five years, while the Carmignac fund lagged behind the three competitors.
Performance of funds over 10 years
Source: FE Analytics
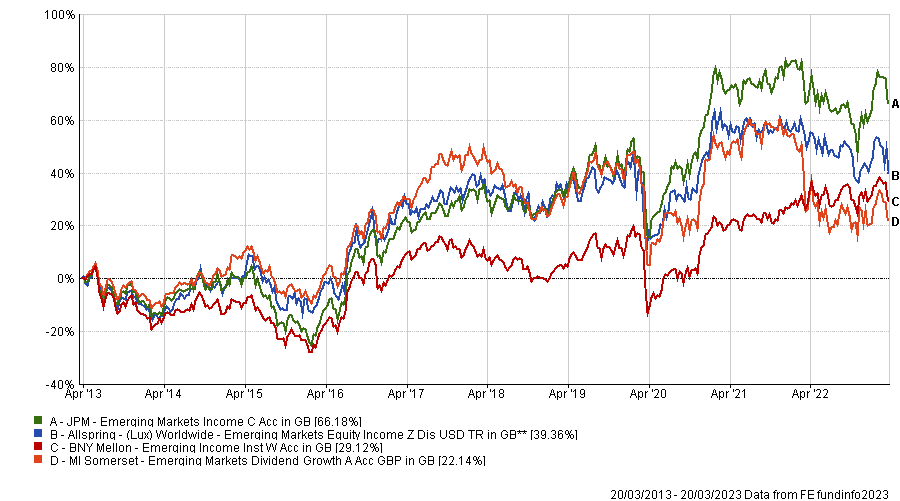
At 47%, the fund with the second-lowest correlation to the Chinese market was BNY Mellon Emerging Income, with other income strategies also occupying relatively low positions in the table, including MI Somerset Emerging Markets Dividend Growth (50%), JPM Emerging Markets Income (64%) and Allspring (Lux) Worldwide Emerging Markets Equity Income (65%).
Among these, JPM Emerging Markets Income and BNY Mellon Emerging Income stand out for their performances, with the former coming out as the top strategy over the past five years, as shown in the chart below, and the latter just a few percentage points below while also achieving a five-crown FE fundinfo rating.
The main differences between the two are in their allocations to Asia Pacific and the Pacific Basin (cumulatively 67.1% and 76% of the respective portfolios), South Africa (2.3% for the BNY Mellon portfolio and 7.1% for JPMorgan) and the UK (6.7% the former, no exposure the latter). BNY Mellon Emerging Income also has 3 percentage points more invested in utilities.
Performance of funds over 10 years
Source: FE Analytics
ETFs also reflected in the trends we highlighted for the active space, with the income and small-cap portfolios by iShares and SSGA SPDR offering correlations to MSCI China between 51% and 59%, followed by the Invesco FTSE RAFI Emerging Markets UCITS ETF and iShares Edge MSCI Emerging Markets Minimum Volatility UCITS ETF, both at 61%.