


The IA North America peer group is the regional fund sector where the most funds have consistently made their sector’s highest Sharpe ratios, Trustnet research has found.
The Sharpe ratio evaluates how much excess return an investment generates relative to the amount of risk it takes, using standard deviation as the measure of risk. A higher Sharpe ratio reflects better risk-adjusted performance, making it a key metric for assessing investment efficiency.
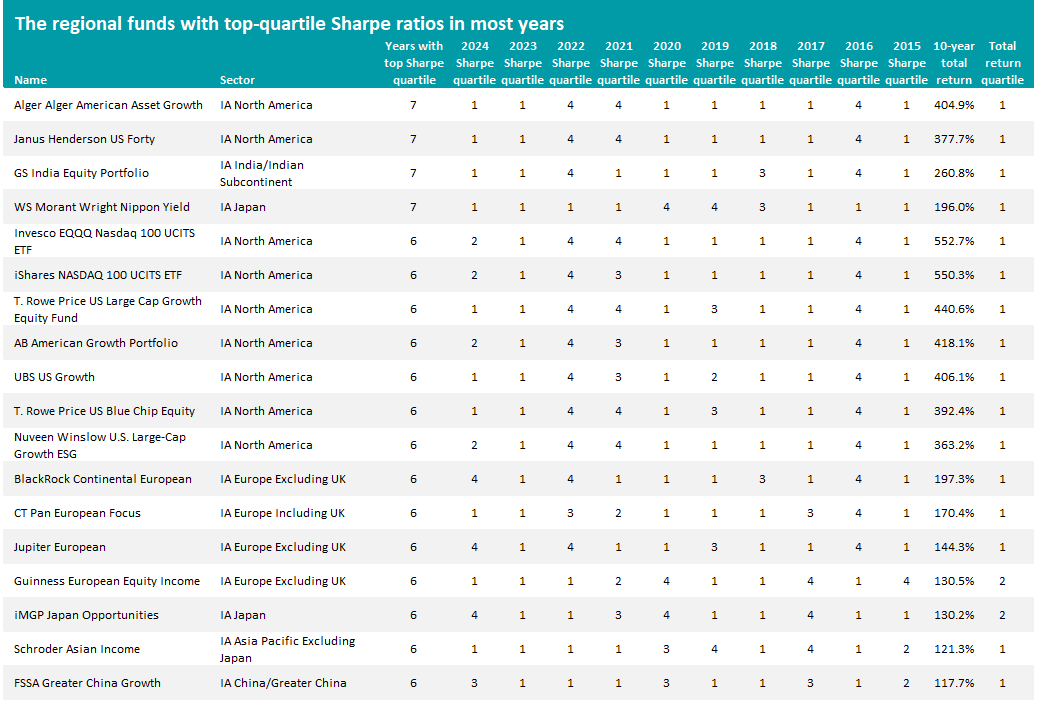
In this series, Trustnet is reviewing funds' Sharpe ratios over the past 10 years to highlight those that have placed in their sector’s top quartile for at least six of those years using this prominent risk-return measure.
This time, we’re looking at the various regional sectors in the Investment Association universe: IA Asia Pacific Excluding Japan, IA Asia Pacific Including Japan, IA China/Greater China, IA Europe Excluding UK, IA Europe Including UK, IA European Smaller Companies, IA India/Indian Subcontinent, IA Japan, IA Latin America, IA North America and IA North American Smaller Companies.
Source: FE Analytics. Total return in sterling between 1 Jan 2025 and 31 Dec 2024.
Across these 11 sectors (home to 536 funds with a long enough track record), 18 funds made the shortlist in this research – four of which are in the top quartile for Sharpe ratio in seven of the 10 years and 14 achieved it in six years.
Half of these funds above reside in the IA North America sector. For much of the past decade, investors could generate high returns in the US market through a narrow band of stocks: growth investing has been in favour for the bulk of the period, especially US tech stocks such as the FAANGs and, more recently, the Magnificent Seven.
The table is ranked by the number of years in the top quartile for Sharpe ratio first, then by the total return over the 10 years to the end of 2024. Alger American Asset Growth sits at the top, thanks to seven years of top-quartile Sharpe ratios and a return of 404.9% (versus 242.4% from the average IA North America fund).
Managed by Patrick Kelly, Ankur Crawford and Dan C. Chung, the fund looks for companies undergoing ‘positive dynamic change’. This means searching out businesses benefiting from high unit volume growth (rapidly growing demand, strong business models and market dominance) alongside positive life cycle change (new management, product innovation, M&A or restructuring, and/or regulatory change).
At the moment, the fund is overweight the information technology, communication services and consumer discretionary sectors with Microsoft, Nvidia, Amazon and Meta Platforms its top holdings.
Performance of Alger American Asset Growth and Janus Henderson US Forty vs sector between 1 Jan 2015 and 31 Dec 2024

Source: FE Analytics. Total return in sterling between 1 Jan 2025 and 31 Dec 2024.
Janus Henderson US Forty is in second place with seven years of top-quartile Sharpe ratios and a 377.7% total return. This is managed by Nick Schommer and Brian Recht, who invest at least 80% of the portfolio in 20 to 40 of their best US large-cap growth ideas.
It is currently underweight the information technology sector, although many of its top 10 holdings fit into this theme, including Microsoft, Amazon, Nvidia, Meta Platforms, Broadcom, Apple, Alphabet and Oracle.
GS India Equity Portfolio has also posted top-quartile Sharpe ratios in seven of the past 10 full calendar years, returning 260.8% over the entire period.
Manager Hiren Dasani is a bottom-up investor who focuses on small- and mid-caps while looking for a combination of good businesses and good valuations; he will not invest in a company if it is not a ‘good business', regardless of its size in the index.
The final fund to make a top-quartile Sharpe ratio in seven of the years we examined is WS Morant Wright Nippon Yield. It made a 196% total return in this time.
Investment boutique Morant Wright focuses exclusively on Japanese equities and the team behind the fund looks for companies that generate strong cashflows, with strong balance sheets and underappreciated assets. It also has a value approach, which limits valuation risk, and leads to underweights towards sectors such as information technology, healthcare and consumer staples.
Among the regional equity funds with six years in the first quartile for Sharpe ratio, some – such as Invesco EQQQ Nasdaq 100 UCITS ETF, iShares NASDAQ 100 UCITS ETF and T. Rowe Price US Large Cap Growth Equity – have made higher total returns than the above funds.
These funds are more focused in their approaches, for example focusing on the Nasdaq. This means they have benefited more directly from the strong gains in these segments of the market, leading to higher returns, but are more exposed to sector-specific volatility.