






Almost a quarter of IA Global funds have flipped from one end of the sector's performance table to the other in recent weeks, as market leadership was snatched from momentum investing.
Analysis from St. James's Place shows that the momentum style, or buying stocks that have recently outperformed, has run around 45% ahead of quality investing since May 2025. This has been driven almost entirely by a small number of companies at the centre of the AI infrastructure trade.
Justin Onuekwusi, chief investment officer at St. James's Place, said the gap has left markets unusually stretched, adding: "Leadership shifts and yesterday's winners do not stay on top indefinitely.
"The risk is that markets appear diversified at the index level, while returns are increasingly driven by a narrow group of companies."
Performance of MSCI AC World and sub-indices between 1 Jan and 18 Jun 2026
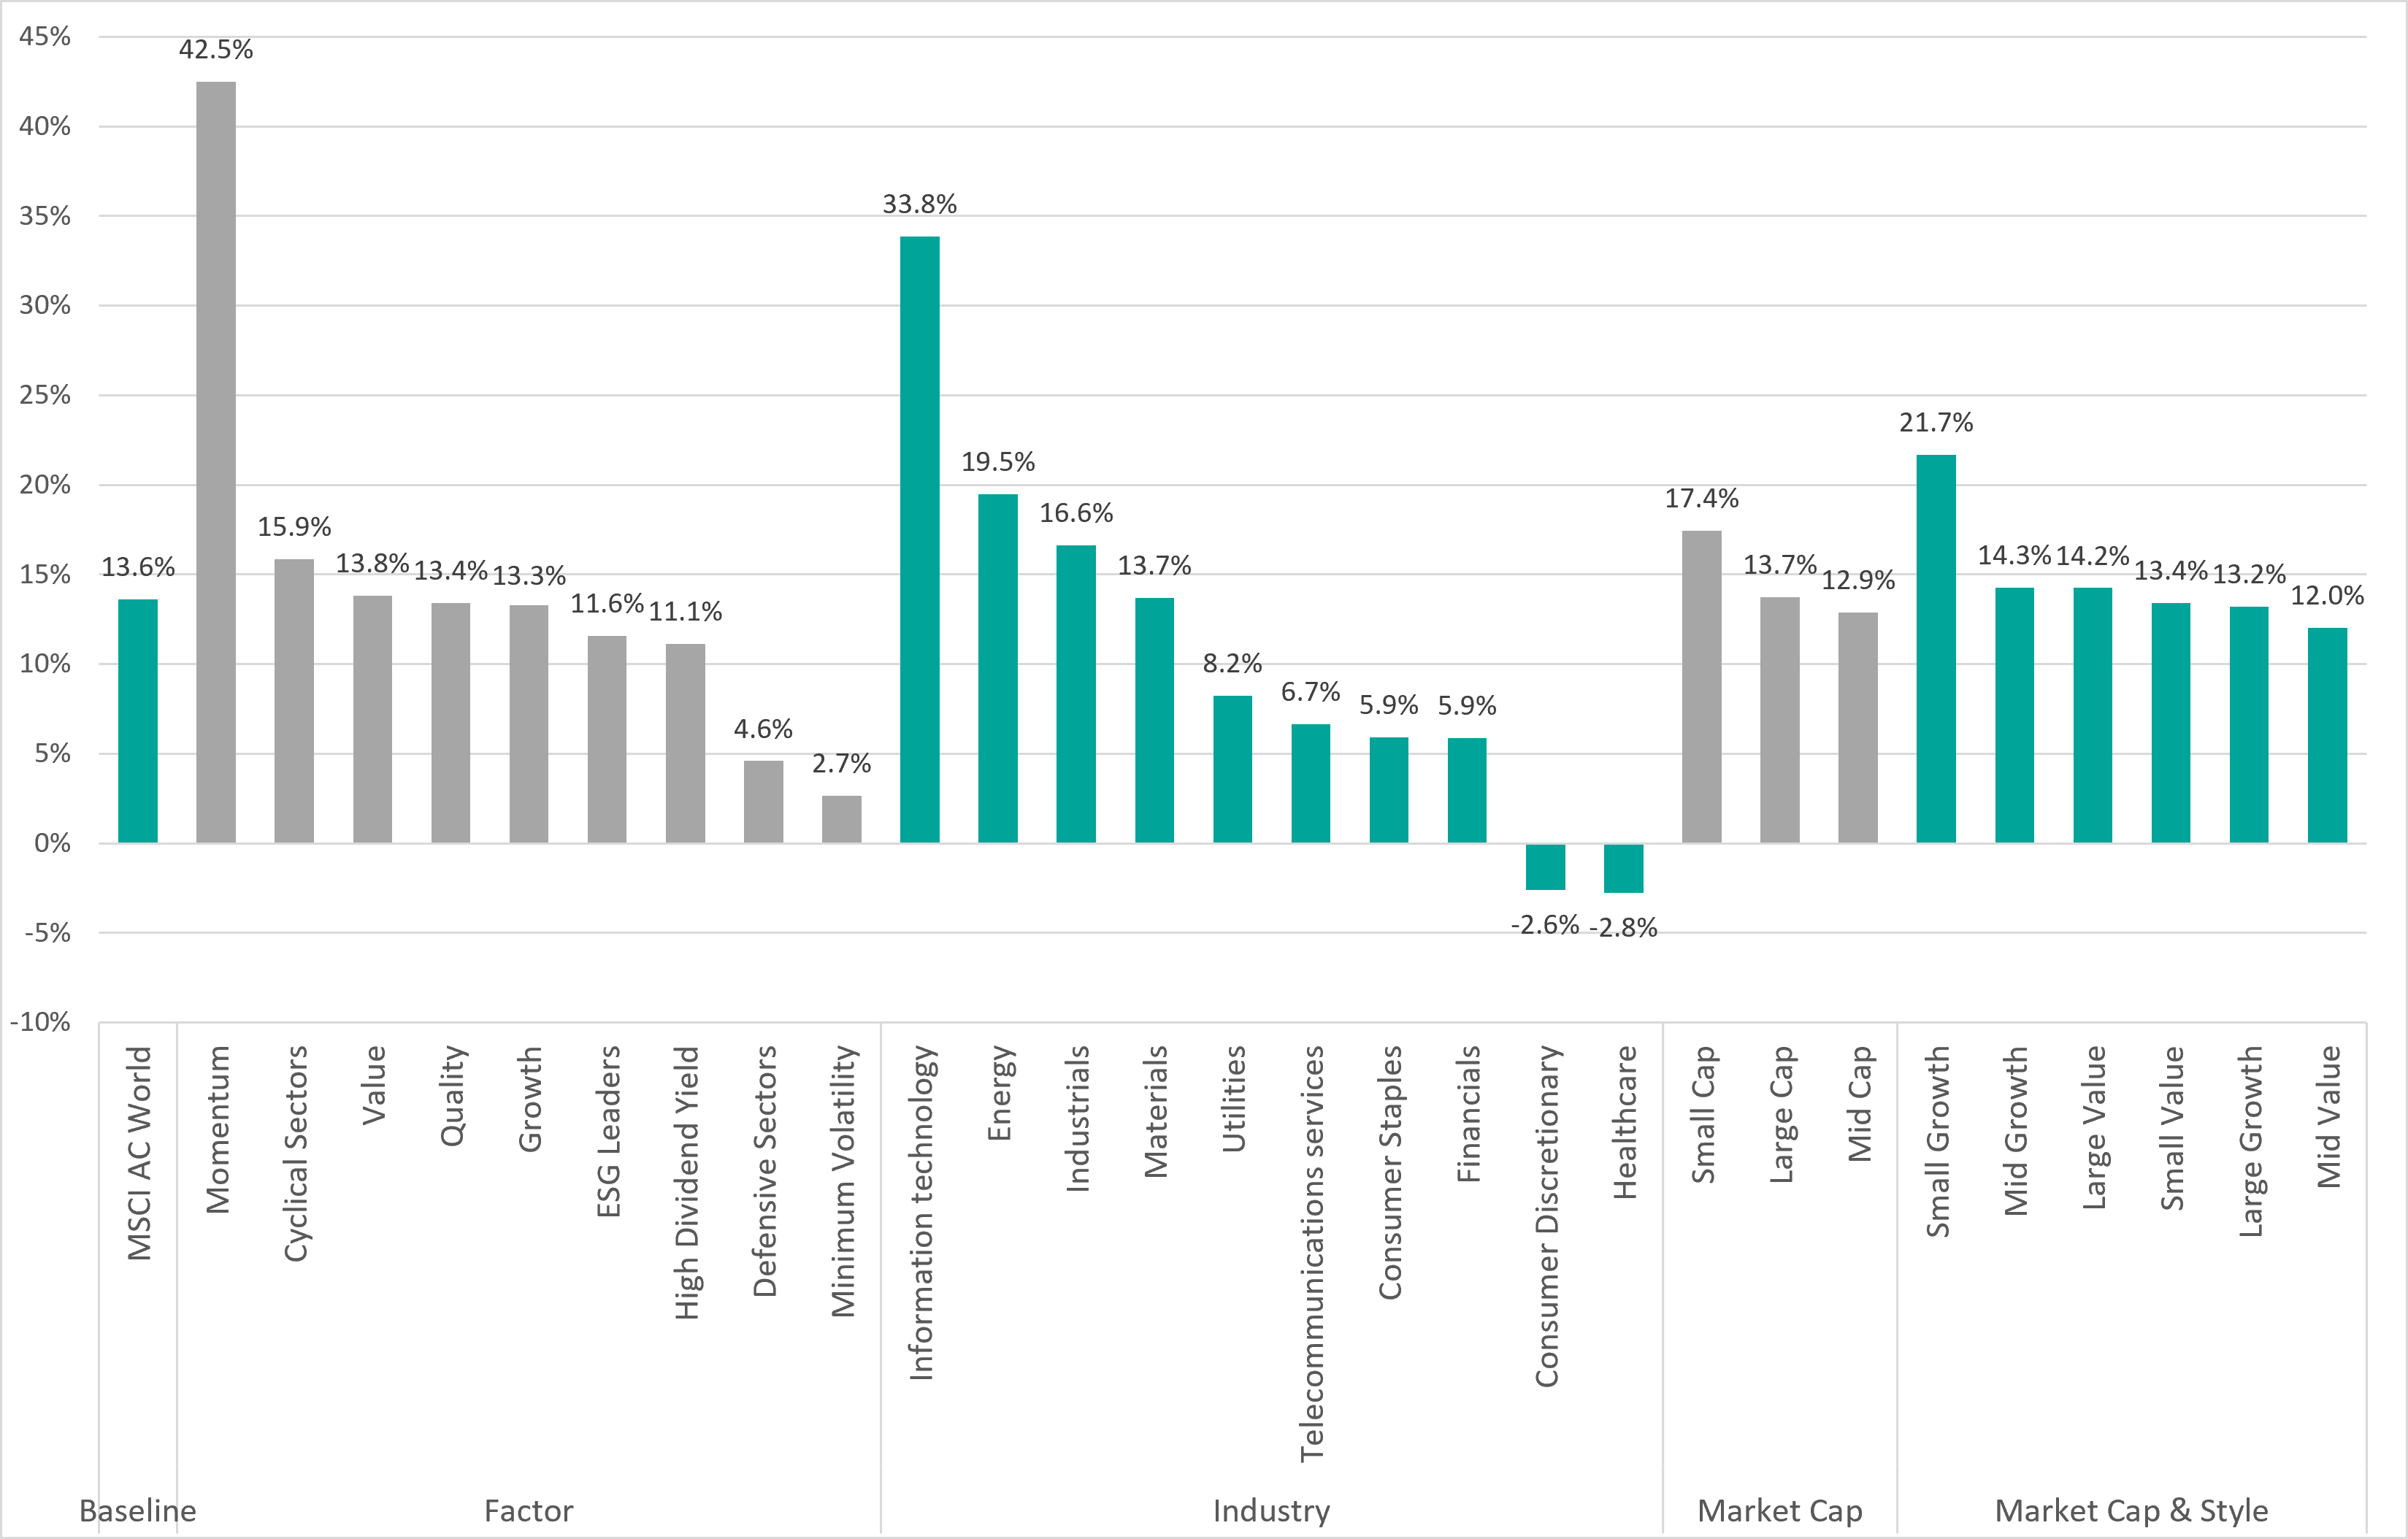
Source: Finxl. Total return in sterling.
This has played out in recent weeks. Global equity markets rallied hard in the first half of 2026, powered by soaring demand for the memory chips and infrastructure behind the AI boom.
Korea's stock market, dominated by chipmakers Samsung and SK Hynix, gained 139% in sterling terms between the start of January and 18 June. Global information technology stocks and the momentum style were far ahead of their rivals.
But the trade has reversed since then. By 24 July, Korea had fallen 26% from its peak and the global momentum factor had gone from a 42.5% gain to an 11.8% loss in just five weeks.
Performance of MSCI AC World and sub-indices between 19 Jun and 24 Jul 2026
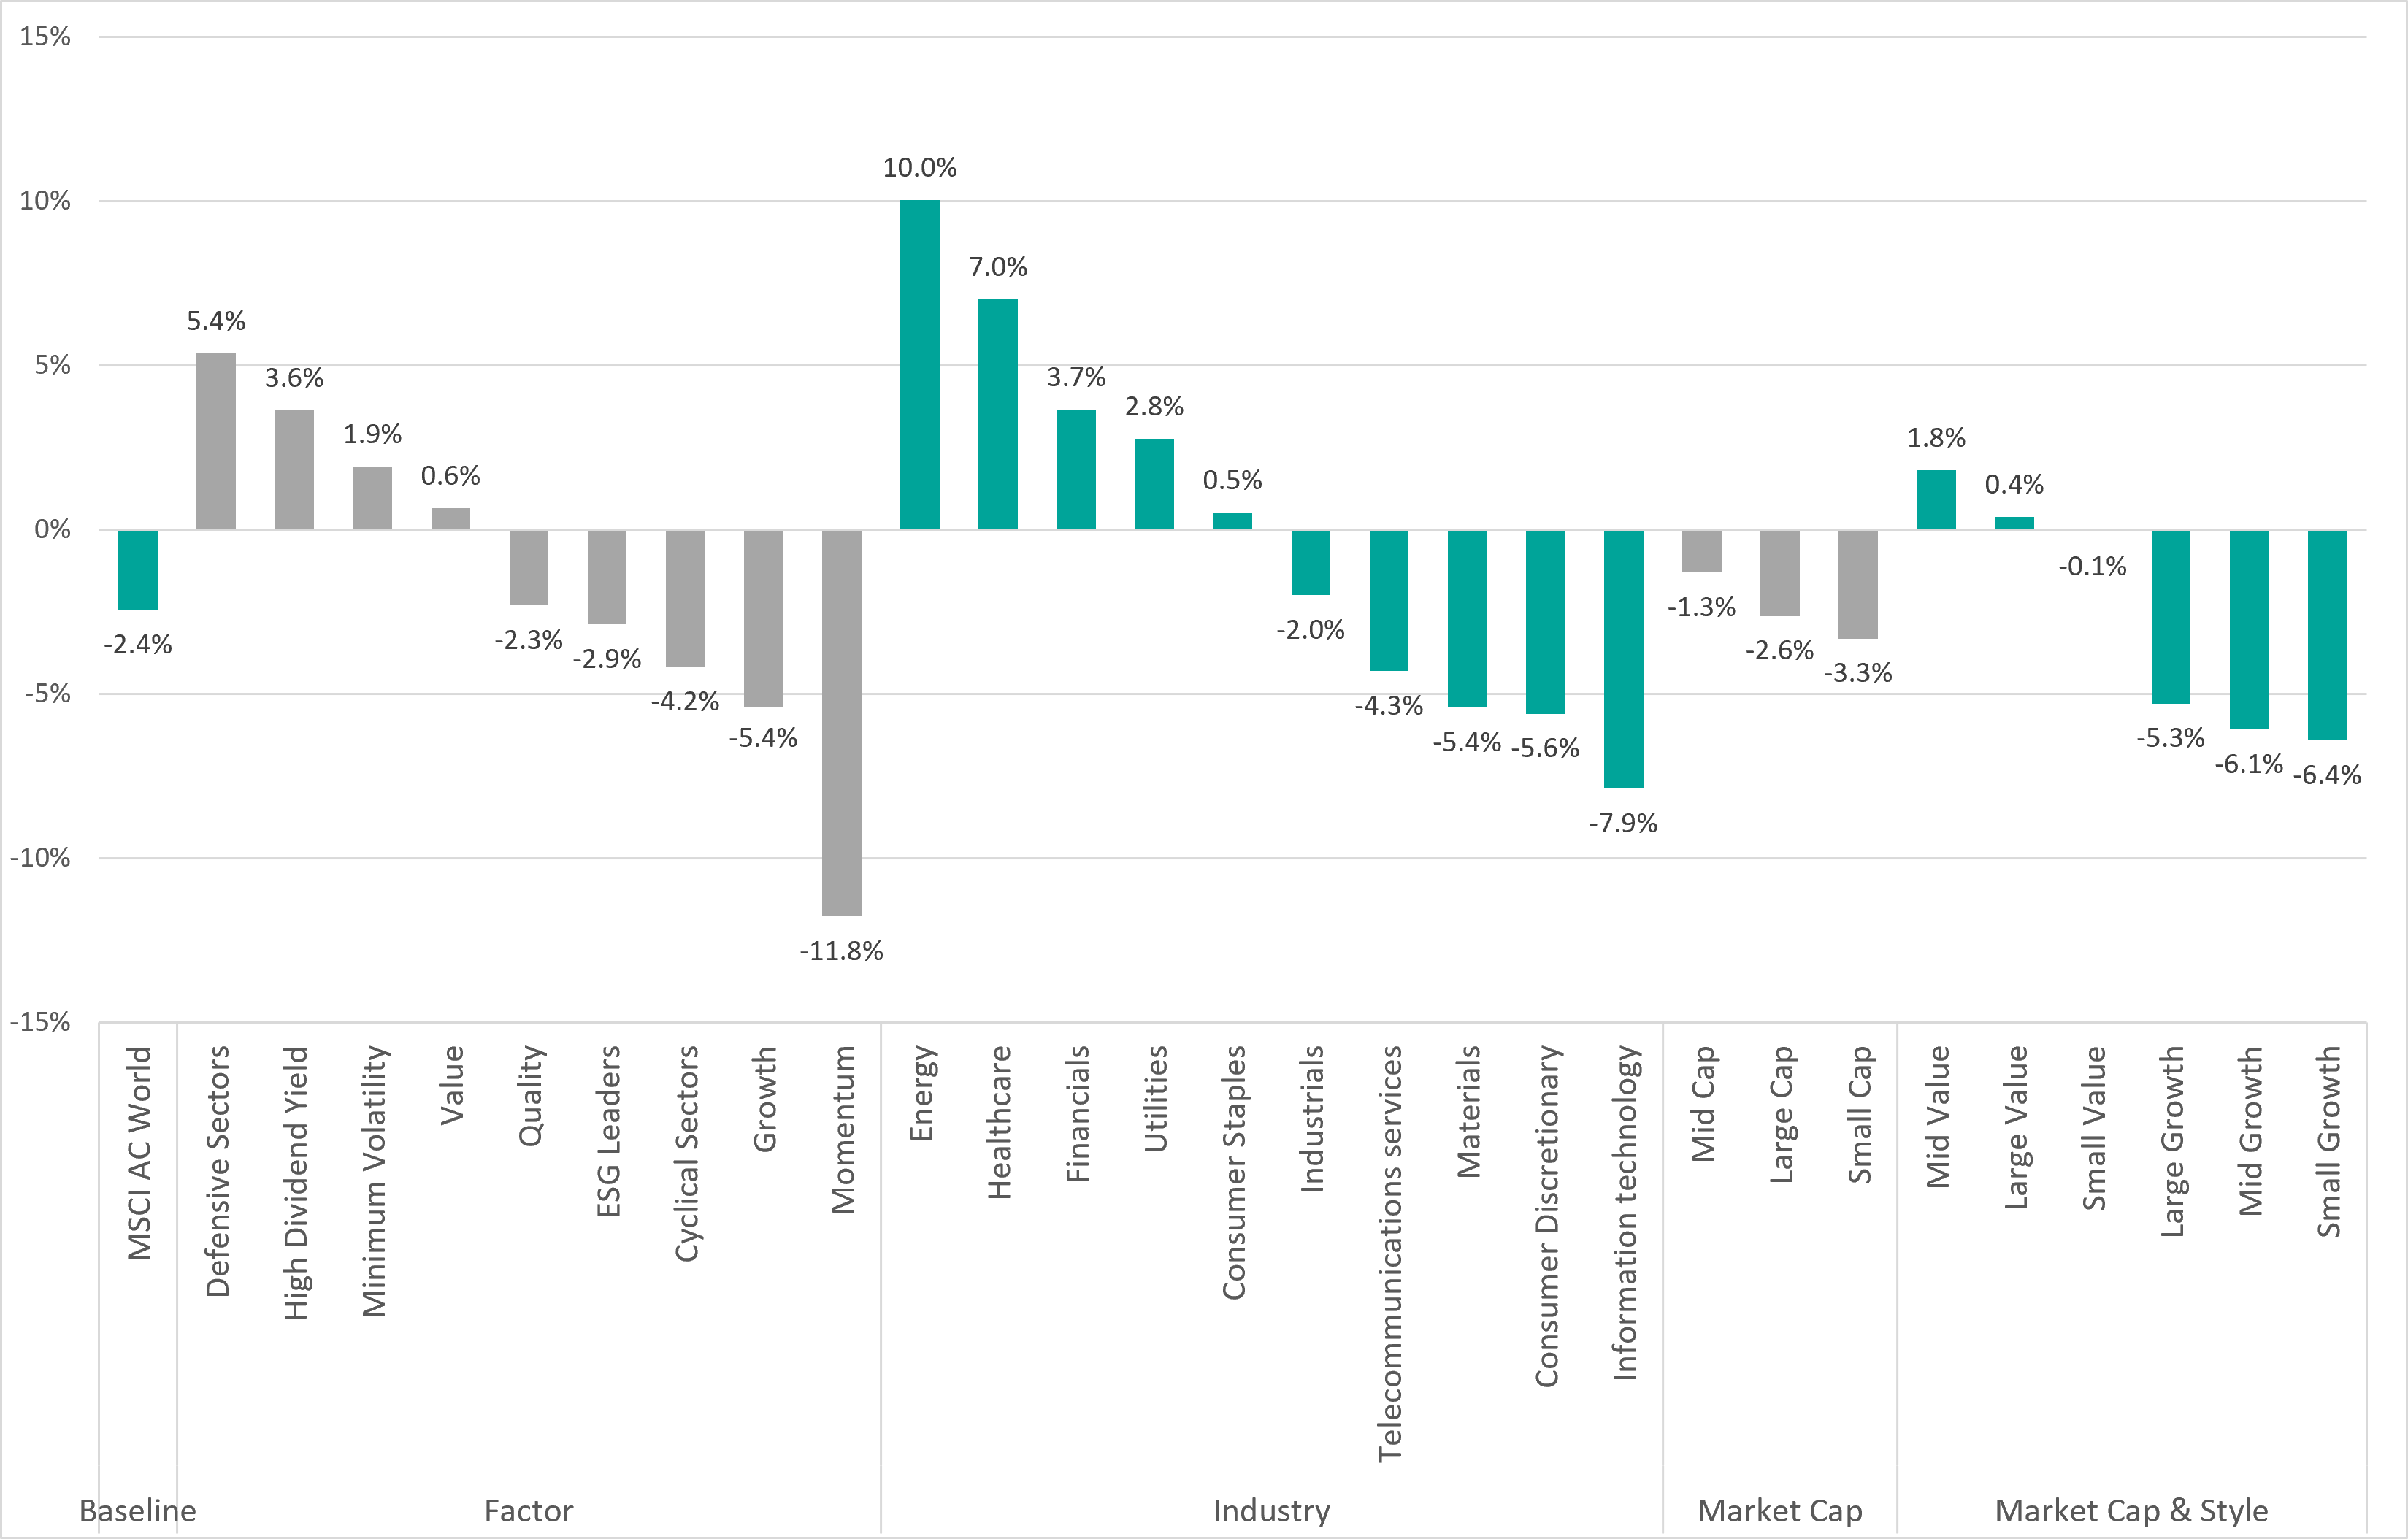
Source: Finxl. Total return in sterling.
In this research, Trustnet has examined how that reversal played out across the IA Global sector's 567 funds, using performance quartiles for the two periods either side of the 19 June turning point. While this is a short timeframe to assess funds on, it can illustrate how momentum is affecting them and how differing investment themes are holding up.
Only a small minority of funds performed consistently across both periods, with 14 staying in the first quartile throughout and 18 getting stuck in the fourth.
Some 75 funds fell from first quartile to fourth and 66 did the opposite, rising from fourth quartile to first. This means 141 funds, close to a quarter of the entire sector, completely flipped position once the momentum trade turned.
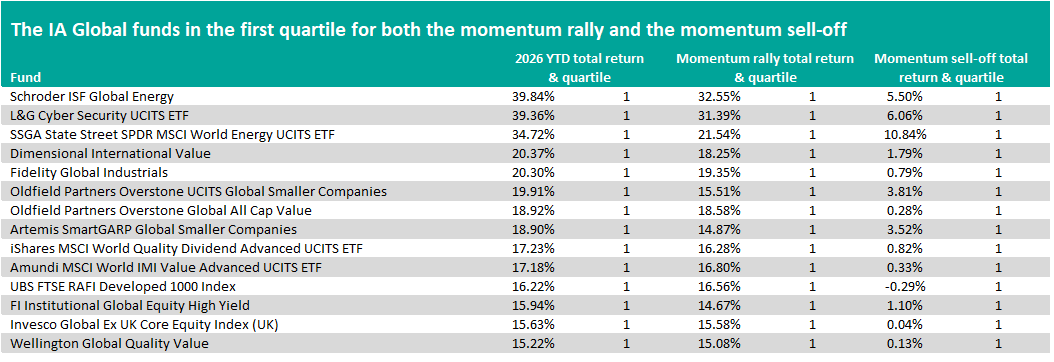
Source: FE Analytics. Total return in sterling.
The table above reveals the 14 global equity funds that were able to generate first-quartile returns over the two contrasting periods. This is the smallest of the four groups, showing how few funds avoided being wrong-footed altogether when market leadership changed.
Common threads include energy funds (Schroder ISF Global Energy, State Street SPDR MSCI World Energy), value and quality-value strategies (Dimensional International Value, Wellington Global Quality Value) and value-tilted small-cap portfolios (Oldfield Partners Overstone UCITS Global Smaller Companies, Artemis SmartGARP Global Smaller Companies).
Energy was the only stock sector to post solid gains in both periods. The US-Iran conflict and the resulting spike in oil prices supported energy stocks throughout, even as the AI trade rallied hard then spluttered.
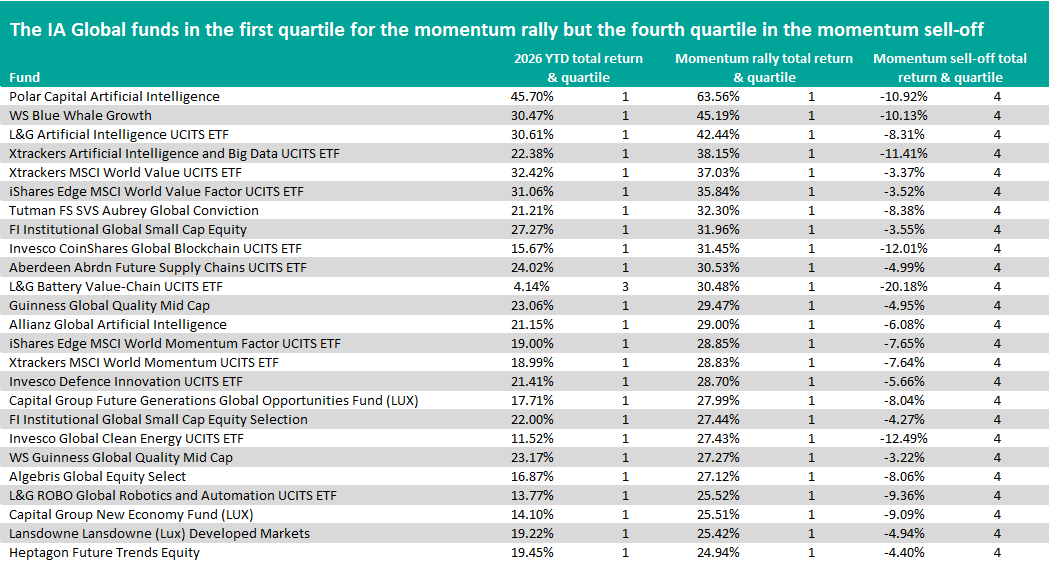
Source: FE Analytics. Total return in sterling.
The largest group by far is the 75 funds that were in the top quartile when the AI and momentum trades were in full flow, then sank to the bottom when they reversed. The 25 with the highest returns in the first period can be seen in the table above.
Many of these funds gained 25% to 60% in the first half of the year, then fell 8% to 12% in the following five weeks, illustrating how violent a momentum reversal can be.
The most notable, and expected, sub-group is the funds investing directly in the AI theme: Polar Capital Artificial Intelligence, L&G Artificial Intelligence UCITS ETF, Xtrackers Artificial Intelligence and Big Data UCITS ETF, Allianz Global Artificial Intelligence and L&G ROBO Global Robotics and Automation UCITS ETF.
There's also the likes of iShares Edge MSCI World Momentum Factor UCITS ETF and Xtrackers MSCI World Momentum UCITS ETF, which offer explicit exposure to the momentum factor.
Growth funds, which tend to look for opportunities in areas such as tech and AI, also went from the top of the IA Global sector to the bottom. Examples include WS Blue Whale Growth, SVS Aubrey Global Conviction and Capital Group Future Generations Global Opportunities.
Source: FE Analytics. Total return in sterling.
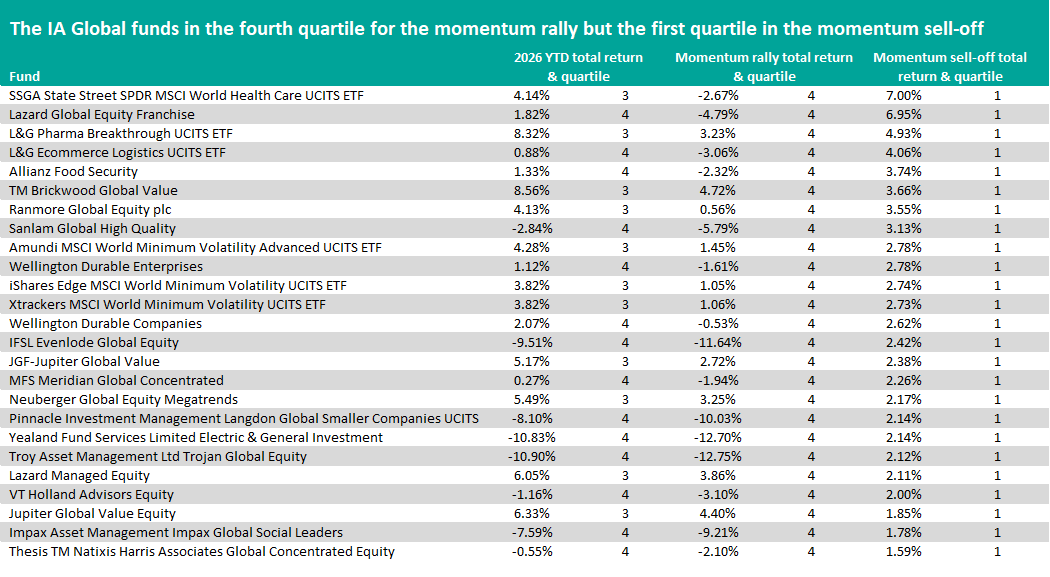
There were 66 funds that were in the bottom quartile of the IA Global sector in the first period, before jumping to the top when the market was upended.
A few themes can be seen in the list of funds above, which shows the 25 with the highest returns since 19 June.
Value funds (TM Brickwood Global Value, Jupiter Global Value Equity, JGF-Jupiter Global Value) and quality strategies (Sanlam Global High Quality, Wellington Durable Enterprises, Wellington Durable Companies) did well. These investment styles fell by the wayside as investors flocked to the momentum approach.
Minimum volatility trackers (Amundi MSCI World Minimum Volatility Advanced UCITS ETF, iShares Edge MSCI World Minimum Volatility UCITS ETF, Xtrackers MSCI World Minimum Volatility UCITS ETF) are built to hold the least volatile stocks in the index, which meant heavy underweights to the momentum-driven tech names and correspondingly less damage when those names sold off.
State Street SPDR MSCI World Health Care UCITS ETF and L&G Pharma Breakthrough UCITS ETF reflect the fact that healthcare stocks went from being down in the first period to gaining 7% since 19 June.
Source: FE Analytics. Total return in sterling.
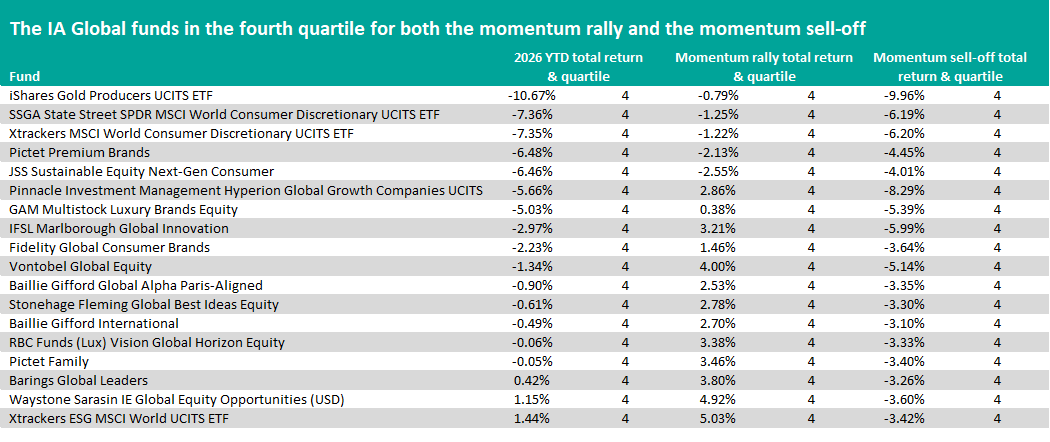
Some 18 funds underperformed in both periods.
Consumer discretionary and luxury brand exposure feature heavily, likely reflecting weak Chinese consumer sentiment across the year. State Street SPDR MSCI World Consumer Discretionary UCITS ETF, Pictet Premium Brands and Fidelity Global Consumer Brands fit this theme.