


Investors are paying more than double the stated ongoing charges figure (OCF) on several North American focused funds due to ‘hidden’ transaction fees, research by FE Trustnet has found.
In this study Trustnet looked at the additional transaction costs (referred to as ex-ante costs) of the IA North America and IA North American Smaller Companies sectors so far this year, having previously looked at the IA Global, UK, Asia and European sectors.
The Markets in Financial Instruments Directive (MiFID II) regulations requires investment houses to disclose additional transaction costs, which are charged on top of published OCFs. Additional transaction costs, otherwise known as ‘ex-ante’ charges, are an unavoidable part of investing since every fund has to trade. But some funds have additional charges equivalent or higher than the stated OCF, costing at least double the advertised fee.
Compared to the other sectors previously examined North America had fewer funds charging investors double the OCF, just eight in total.
The results for the sectors are shown below, which detail the transaction costs, original OCF and the total cost, as well as how many times more an investor paid overall versus the stated fees.
It is also conditionally formatted against the sector. The colours represent how expensive a fund’s cost is relative to the entire sector since higher transaction costs do not necessarily mean that a fund is expensive. Those in green are the cheapest among their peers, while red indicates the most expensive. Orange represents just above average and yellow just below average.
The OCF figures were based off the main driver share class in FE Analytics and charges may vary depending on the share class available.
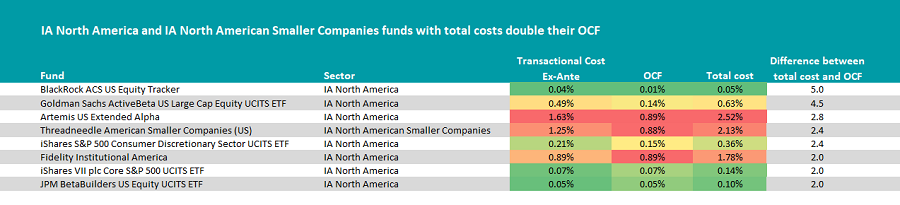
Source: FE Analytics
The North American equity market is one of the hardest to outperform, mainly because it is so popular, making it very liquid and very well researched, making it more difficult for managers to find ‘hidden gems’.
Its popularity among investors could be due to its strong performance, which has mainly been driven by handful of technology and internet names. Still, the S&P 500 has made 345.8% total returns over 10 years, almost nine-fold the FTSE 100’s total (97.2%).
Looking at the funds, there were just three active funds on the list: Artemis US Extended Alpha, Fidelity Institutional America and Threadneedle American Smaller Companies.
Artemis US Extended Alpha had an OCF of 0.89% but one of the highest ex-ante costs across the study, 1.63%, makings its total charges almost three times higher than the stated OCF.
The £460m fund is run by FE fundinfo Alpha Manager William Warren and Chris Kent. Warren previously ran money at Colombia Threadneedle and brought over the practice of taking long and short positions to his Artemis funds.
The fund does not have a single style bias, shifting between value and growth when appropriate. For example, the fund currently has a higher weighting to quality and growth but at the end of last year the managers were adding to their holdings with more cyclical characteristics to take advantage of the global economic recovery from Covid.
The fund has beaten the S&P 500 index over five years, making 111.1% versus 110.6%. It also beat the average IA North America fund during that time (99.7%).
Next was Fidelity Institutional America, with had both an OCF and ex-ante costs of 0.89%, meaning investors were paying exactly double the stated charges overall.
Although managers Nick Peters and Ayesha Akbar invest irrespective of the benchmark, the top 10 is full of some of the S&P 500’s biggest contributors, including Microsoft, Alphabet, Amazon and Apple. The fund has a qualitative-based process, investing at least 70% in US equities – it is currently 95.6% invested in this market. The remainder is spread across other equity markets and cash.
The third active fund on the list, and only one from the IA North American Smaller Companies sector, is Threadneedle American Smaller Companies.
The fund’s overall cost is 2.4 times higher than the stated OCF (0.88%) due to additional costs of 1.25%.
The fund operates in a more risky part of the market compared to the large-cap focused funds in this study. Within its sector the fund has performed well, making the third-highest returns in 10 years of 411.5% arguably justifying the higher overall costs. Its average peer made 329.4% during that time.
The rest of the funds on the list were passive options, many of which tracked the US large-cap indices.
Passive funds are typically seen as a cheaper way to invest in broader markets, and have become an increasingly popular option for North America, given how difficult it is to outperform.
But trackers still have to trade and this can lead to a higher overall cost, although this does not meant that passives are expensive. For example, the BlackRock ACS US Equity Tracker had a total cost five times higher than the stated OCF, the biggest increase in the study, but its total cost was still just 0.05%, which was very low within the sector.
Overall all the passive funds highlighted had total costs lower than the aforementioned active funds, even if their total increases were higher. The other portfolios were: Goldman Sachs ActiveBeta US Large Cap Equity UCITS ETF, iShares S&P 500 Consumer Discretionary Sector UCITS ETF, iShares VII plc Core S&P 500 UCITS ETF and JPM BetaBuilders US Equity UCITS ETF.